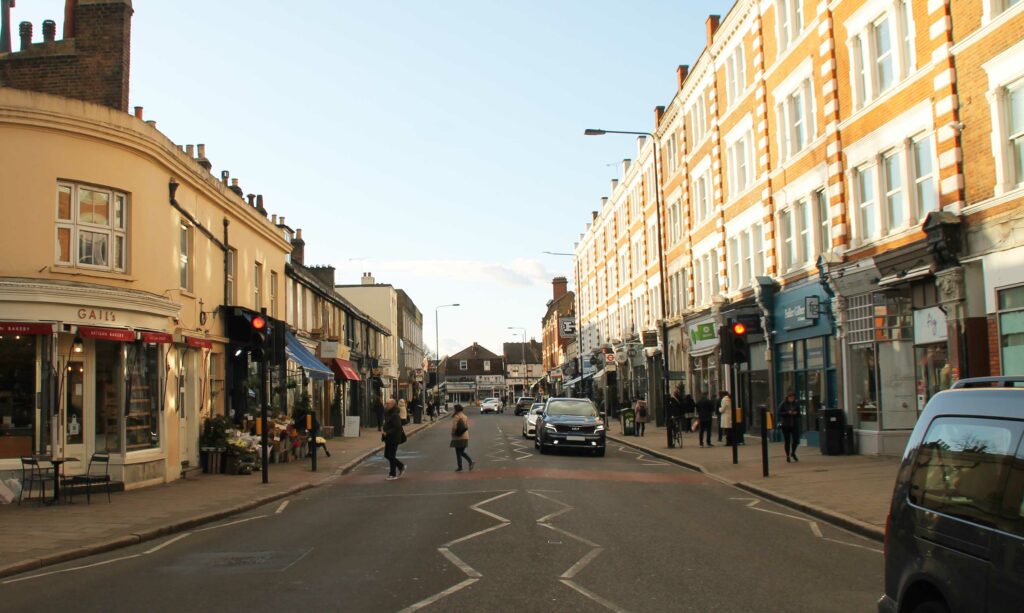
- VivaCity sensors are gathering footfall and traffic data in Wimbledon High Street to understand high street health
- This data will be used to identify if there has been a ‘bounce back’ of movement since September 2021, following the lifting of Covid-19 related restrictions
- Alongside impact of Covid-19 related conditions, data has revealed the extent to which severe weather affected high street activity
The role of the high street in 2022
The future of the high street was already ominous before the arrival of Covid-19, prompting the launch of the Government’s Future High Streets Fund in 2018.
Online shopping, offering more choice and competitive prices, was its primary threat, forcing high streets to rethink their role in the 21st century.
To survive, they need to offer a more holistic experience for their communities. With the majority of retail and service functions of the high street now provided online, the social, experiential and ‘sense of place’ aspect of the high street has become its key strength and appeal.
The impact of Covid-19 on high street health
Covid-19 severely compromised high street health, with lockdowns, enforced shop closures and work from home guidance all posing barriers.
When the Government announced Plan B measures in December 2021 in response to the Omicron variant, people were encouraged to work from home once more and mask wearing became compulsory in most public spaces. Many people decided to cancel Christmas parties and limit their social interactions.
The result was that the once prosperous, high performing, commercial high street areas – those with higher densities of restaurants, bars and retail – saw the greatest decline in footfall.
Evidenced in Data: Wimbledon High Street Footfall Monitoring
Following the lifting of restrictions in January this year, VivaCity worked closely with Merton London Borough Council to evidence the impact that restrictions had on footfall, and to identify if there has been a ‘bounce back’ in the months following.
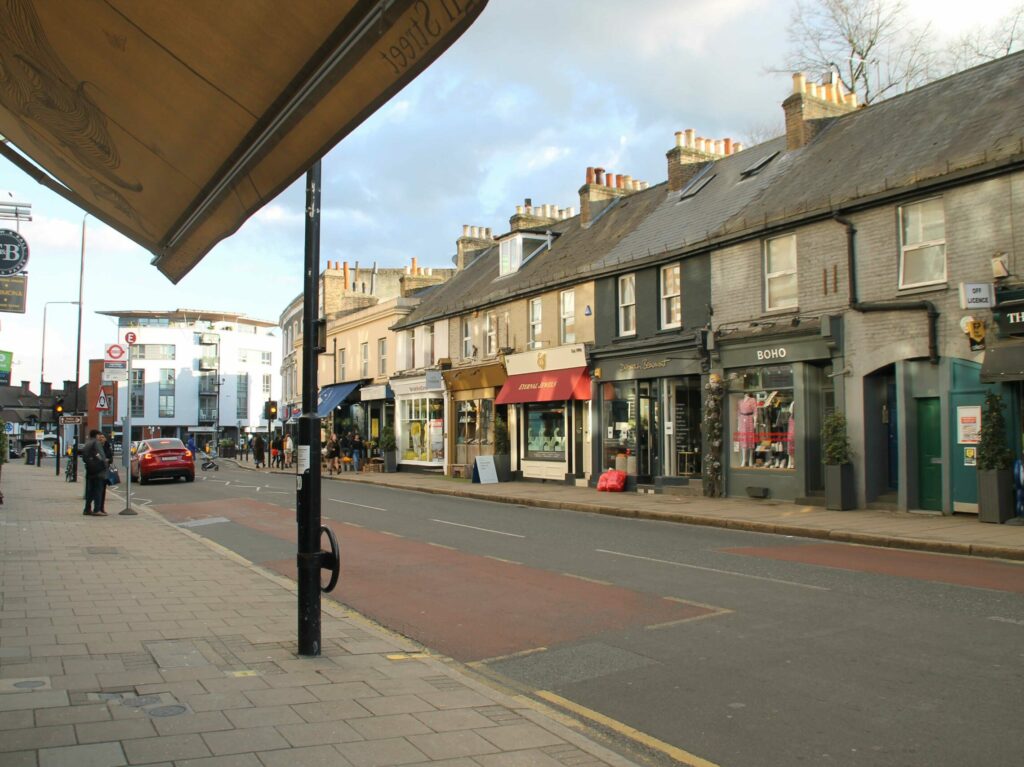
Wimbledon High Street
With VivaCity’s AI-sensor technology, it’s possible to analyse high street pedestrian and traffic movements over a sustained period of time, with an industry-leading degree of accuracy, bringing substantiated evidence of high street health.
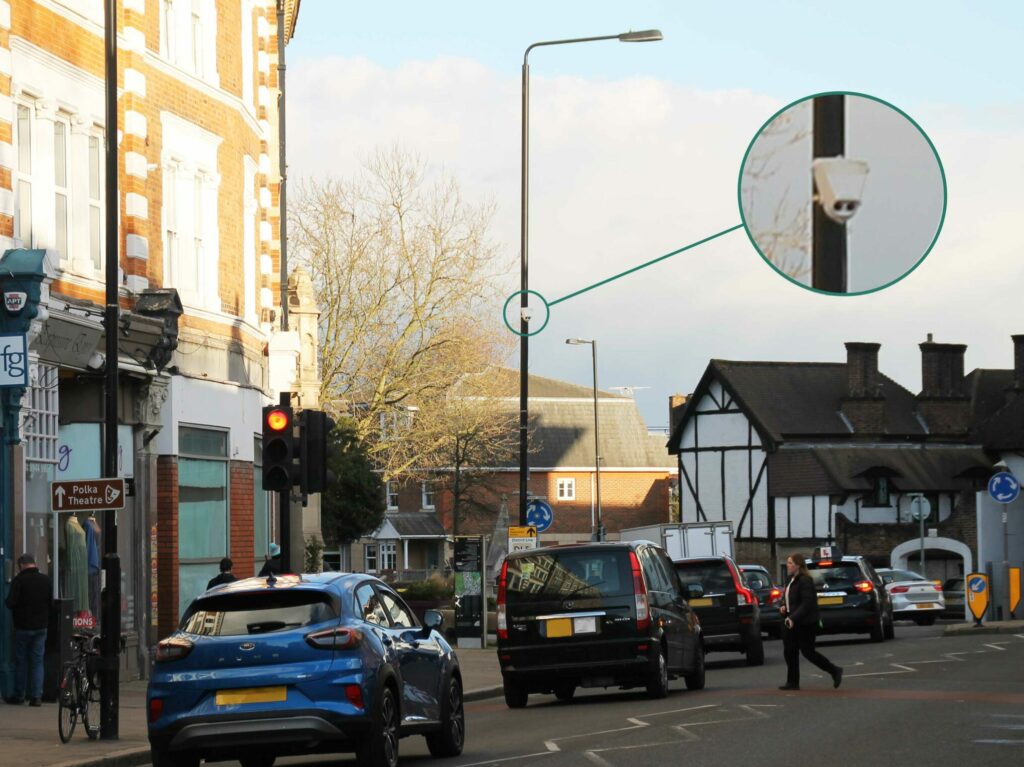
A sensor was installed in September 2021 on an existing piece of street furniture on the high street. Countlines were allocated across the roadway and to the pavement on either side to count the volume of road traffic (including cars, buses and cyclists) and pedestrians, as well as their direction of travel and their paths across the sensor’s field of view.
Four key insights that the data has revealed
1. Traffic volumes fell across all modes during Plan B period
During the six weeks of Plan B restrictions, total traffic fell by 8% compared to six week prior.
Motorised traffic decreased the most (-12%) followed by cyclists (-9%) and footfall (-3%). However, all of the decrease in footfall was recorded on weekends, which saw 17% fewer people walking, while weekdays increased (5%). In the five weeks following the easing of restrictions, total volumes increased by 3% but not fully reaching levels seen before.
It’s important to note that trends during Plan B measures are strongly impacted by Christmas Day when traffic volumes more than halved compared to average levels.
2. Footfall is highest on weekends while motorised traffic peaks on Fridays
There are clear weekly patterns for traffic counts on Wimbledon High Street.
Motorised traffic peaks towards the end of the week and is lowest on Sundays, while there is higher footfall on weekends.
These patterns are fairly consistent throughout the period data was recorded. On average, people walking make up 44% of road users on Saturdays and 47% on Sundays. On a couple of Sundays, pedestrians made up more than half of all road users, including 14 Nov 2021, 05 Dec 2021 and 09 Jan 2022.
3. Footfall on Saturdays strongly impacted by bank holidays and weather conditions
While footfall is usually highest on Saturdays, it is strongly linked to external events and weather conditions.
Looking at traffic volumes for Saturdays, levels of footfall are notably low during Christmas Day and on days with weather alerts. In February, Storm Eunice slowed down a bounce back effect. On Saturday 19 Feb 2022, 8,777 people were recorded on the local high street compared to an average of 12,738 for the other Saturdays of the month.
4. Footfall on Saturdays peaks around midday exceeding number of motorised vehicles
There is a clear daily pattern on Saturdays. Both motorised traffic and pedestrian counts peak around midday, with footfall exceeding motorised traffic during these hours. In February, pedestrians made up 57% of all road users between 11am-4pm. Pedestrian volumes shift in line with daylight hours. There were more people walking earlier in the morning and later in the afternoon in February compared to December.
Summary of data insights
As well as fluctuation in response to Covid restrictions, the sensor recorded the impact that extreme weather events had on high street activity.
Weather conditions and special events such as bank holidays (Christmas) had a much bigger effect on high street footfall than Plan B restrictions this time.
This incidental finding indicates that climate uncertainty and increasingly volatile weather patterns, are already an important factor of high street activity and will continue to be. Being able to ’weather the storm’ will be key to high street resiliency.
This correlation with weather also suggests that as we enter Spring, and with Summer ahead, longer daylight hours, warmer weather and Bank Holidays are likely to draw more people to the high street.
Discover how computer vision sensors can help accurately monitor Active Travel schemes
DOWNLOAD OUR ACTIVE TRAVEL BROCHURE NOW
Accurate data and insights for traffic monitoring
Collecting the data and interpreting these insights was possible using VivaCity's computer vision traffic monitoring sensors. Our sensors gather anonymous, 24/7, classified data on up to 32 different types of road users (including pedestrians and cyclists), identifying paths, speeds, near misses and journey times.
With 100+ local authorities using over 4,500 sensors in the UK, our solution has been helping customers accurately understand and assess the impact of their road schemes.
Find out more about how our traffic monitoring solution works and get in touch if you have any questions or would like a free demo and and consultation for your upcoming schemes.
Like our content? Sign up to our newsletter and receive the latest updates in your inbox.