Our CEO, Mark Nicholson, discusses with Open Access Government magazine how local lockdown travel habits are already influencing the green recovery.
With restrictions in the UK now easing, residents have spent much more time in their local area than ever before during lockdown. Whether it was walking around the local park, cycling around the area, or running new routes, the distance people travelled significantly decreased.
Before 2020, 60% of journeys between 1-2 miles were made in cars and cycling rates were low. However, the TfL cycle count, which usually takes place in Spring and was instead pushed to Autumn in 2020, revealed a 7% increase in cycling in inner London and a 22% increase in outer London, compared to the previous count in spring 2019. These shifts in behavior are expected to carry on as pandemic restrictions continue to be eased and lifted. In a recent study for BBC News and King’s College London, 40% said they expected to walk more, 31% intended to shop locally more and 28% said they will cycle more than before the pandemic.
With active transportation (e.g. walking, cycling, scooting) increasing and residents staying local more often, the impact that 2020/21 has on green travel is significant. But how are these changing travel trends affecting policy and the transport networks of our towns and cities? And why is technology and data so crucial for the success of implementing these changes moving forward?
Read more on the Open Access Government website.
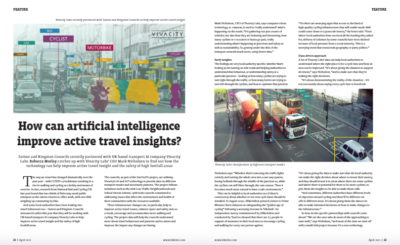
Viva offers a unique solution using artificial intelligence-powered sensors installed in strategic locations on the road that capture anonymous, real-time, continuous traffic pattern data of road users.
- Traffic counts and classifications, including pedestrians, cars, taxis, trucks, cyclists and more.
- Vehicle Path across the road space to understand how different vehicles interact and to assess junction turning counts.
- Median Journey Time of road users with number plates between any two sensors within the network.
- Speed to capture travel behavior and identify queue formation.
Like our content? Sign up to our newsletter and receive the latest updates in your inbox. Sign-Up