There’s no doubt that people are changing how they travel, and cities and towns are adapting to this. Throughout the last year, active transportation has continued to increase and reach new levels – in autumn 2020, the Transport for London cycle count showed a 7% increase in cycling in inner London compared to the previous spring. Pop-up active transportation schemes to enable more walking and cycling are everywhere and now look to become long-term components of our infrastructure. This has also been met with an increase in private vehicle use and decrease in public transport, further altering the landscape of our roads.
When looking at these active transportation schemes, there’s a common theme: whether the project will be a success or a failure comes down to data. Almost all of the schemes that fail don’t have accurate, reliable and timely information. This means they’re unable to:
- Plan for their scheme effectively
- Monitor and measure the benefits reliably
- Provide detailed evidence to the public and other stakeholders
With increasing demand for improved consultation, there is now greater pressure on authorities to understand current travel behaviors. This is particularly important when it comes to capturing the impact new schemes have on modal shift behavior and the benefits they deliver.
In the past two years, almost 40 Local Authorities (growing weekly) have started relying on our sensors for valuable information on multi-modal travel. Using machine learning and AI, our sensors can improve traffic insights and provide highly accurate and up-to-the-minute data on urban movement and usage.
But how can this data empower traffic managers and transport planners?
The Before: Planning implementation
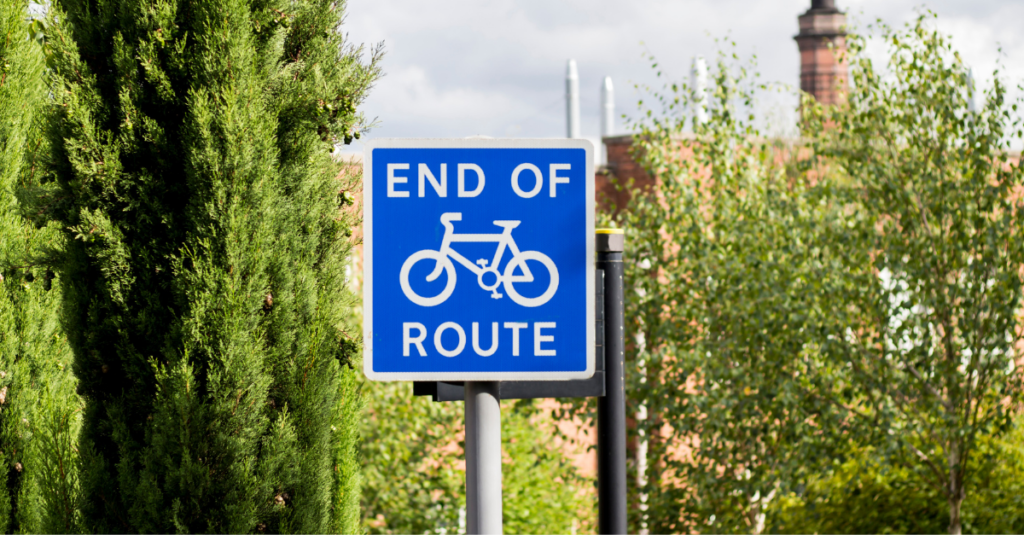
The onus is now on authorities to implement long-term infrastructure changes and facilitate the growing demand for active transportation and sustainability. Such changes include making temporary cycle lanes permanent, creating new cycle lanes, extending pedestrianised space and introducing Low Traffic Neighbourhoods.
For councils to know where to implement such schemes, they need to have the right data. ‘Fail to prepare, prepare to fail’ rings true here. Schemes that are introduced with limited insight into how roads and pavements are already being used will risk their success.
One sensor alone, however, can provide insights on a whole array of different road users. It can anonymously identify nine different classifications (soon to be 20), including pedestrians and cyclists, and how they interact with each other. These data insights give authorities the ability to analyse multimodal travel trends through counts (e.g. 15 cyclists, 8 pedestrians), behavior, pathways and speeds of road and path users – in real time. Councils can then have detailed and highly accurate insight into current interactions in the area, showing overall changes in travel and micro-trends in local active transportation uptake, for example.
The During: Real-time data insight
This same insight is just as crucial for when the schemes have been implemented. Collecting this anonymous data on the coverage of cycle lanes is incredibly valuable, with a single AI sensor able to provide data for a segregated cycle lane, a footpath next to the road, and a mixed carriage way, among others.
If a new segregated cycle lane has been introduced, the sensor can assess, firstly, how much the lane is being used by cyclists: for example, has there been an increase in cyclists along the route from before? Are cyclists using the lane instead of the road? Secondly, the effect the lane is having on other road users: has it reduced (or increased) the use of private vehicles, congestion and emissions? This can all be accumulated through AI sensors placed at specific junctions or positions along target routes.
Councils can then easily download this data via cloud-based dashboards. With this enhanced insight, schemes and networks can then be adapted, extended or reduced depending on what the data shows.
The After: Evidence
With this data, authorities then have the ability to provide objective ‘before, during and after’ evidence for the benefits of such schemes and whether they have contributed to a mode shift in travel. Monitoring and reporting after the scheme has been implemented is also fundamental for consultation purposes and to settle any debates that may arise.
For example, last summer, with Viva sensors installed in the area, Westminster City Council had data to study the impact of measures to discourage vehicle congestion by increasing footpath space to improve social distancing.
Following the introduction of an intervention in St John’s Wood in early July, with extra space accommodating more people walking at a distance, data showed that all motorised vehicle volumes dropped to 70% below normal (before) levels and pedestrian rates steadily increased to above 145% compared to June conditions. Despite the preference for taking personal vehicles during this time, data supported the positive impact of the intervention in prioritising active transportation and reducing traffic.
With data readily available, the benefits of the scheme – before, during and after – were there for all to see.
If you’d like to know more about how our artificial intelligent powered sensors and the data it provides can support your Active Transportation schemes, please get in touch.
Find more information on the Westminster City Council scheme supported by Viva and visit the Westminster City Council official website.