The road safety revolution has arrived
With a range of datasets all available from the same sensor, including Near Miss incident detection and e-scooter behaviour insights, computer vision technology is revolutionising Road Safety management.
For too long road safety assessment, planning and decision-making has been based on analysing the causes of accidents after-the-fact.
This cycle needs to be broken. To achieve Vision Zero goals of ending traffic-related deaths and injuries, road safety decision making must shift from being a reactive process to a proactive one.
Computer vision technology powered with artificial intelligence makes this possible.
VivaCity sensor datasets identify the accidents waiting to happen. This involves much more than simply assessing if speed limits are being adhered to or if vehicles are stopping at red lights.
Our tech digs deeper, providing the most intricate datasets to get to the core of the most complex Road Safety issues.
Saving lives with data insights.
Our sensors capture insights into Near Miss events, vehicle yielding rates and how emergent transport modes, like e-scooters, are using the network.
VivaCity paints the full, data-rich, picture.
By harnessing the power of computer vision, VivaCity’s intelligent traffic monitoring solution is arming local authorities and transport bodies in the UK and beyond with unprecedented insights into road user behaviours. Our customers are using the power of data to identify patterns and trends over time, across all transport modes, and save lives.
Discover 10 ways VivaCity data insights are supporting road safety strategies
1
VivaCity’s Near Miss data is pioneering proactive road safety management
How can we quantify the risk of collisions on a stretch of road and identify the prime root causes?
Primary dataset: Near Miss
Process
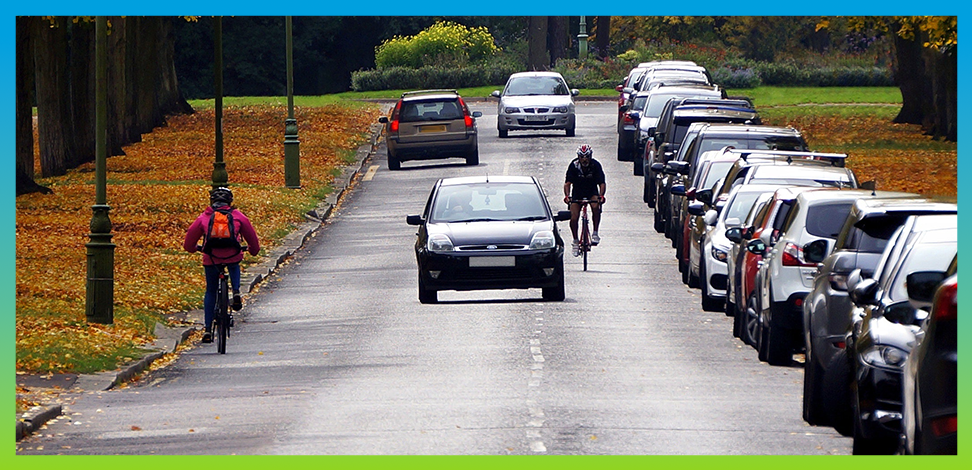
Made possible with VivaCity’s new 3D detection capabilities, Near Miss combines speed and path data to analyse post-encroachment time of vehicles as they cross a single point in the sensor’s field of view. This dataset can be used to better understand where there is the highest risk of a collision along a road or within an intersection.
Data-led decision making
By identifying ‘the accidents waiting to happen’ – and more importantly, their root cause – Near Miss data can guide road safety investment and be used to evaluate road safety interventions by comparing baseline data with post-implementation results.
Hear from VivaCity’s Peter Mildon on how Near Miss data is gathered and its real-world applications, in this recording from Road Safety GB Joining the Dots 2022.
2
E-scooter detection reveals how new micromobility modes are using the network
How are e-scooters using the road network?
Client: University of Westminster, Active Travel Academy
Primary dataset: Classified Counts (e-scooter detection)
Process
VivaCity sensors capture data on both rental and privately owned e-scooters. The University of Westminster is using this data to analyse e-scooter behaviours and better understand how this new form of mobility is integrating into the road network.
Data-led decision making
This data enables a detailed understanding of e-scooter behavioural patterns and interactions, along with uptake rates, of a mobility that isn’t traditionally monitored by other monitoring technology.
3
County-wide speed and active travel data
is supporting road safety strategy
How have 20mph zones impacted active travel uptake?
Client: Devonshire County Council
Primary datasets: Zonal Speed; Countline Speed and Classified Counts
Process: With Speed and Classified Count datasets, Devon can understand if reduced vehicle speeds have encouraged more active travel by making cyclists feel safer on the road.
Data-led decision making: By analysing data gathered across the sensor network, Devon can establish the best locations for 20mph zones and identify if different environments require different solutions to make roads safer for walking and cycling.
4
Cycle flow data is supporting cycle infrastructure business cases
How do cyclists use existing infrastructure and what can we do to make our roads safer for them?
Client: Bristol City Council
Primary datasets: Classified Counts
Process
In August 2020 Bristol City Council closed Bristol Bridge to general traffic and used six VivaCity sensors to support an in-depth evaluation of the closure on cyclist volumes and flow.
Data-led decision making
With accurate, 24/7 multimodal road use data, Bristol have developed a deep understanding of modal distributions and cycling trends, such as daily and weekly patterns. This long-term monitoring strategy is being used to plan and inform future interventions with cyclists’ safety at the core.
5
Turning Count data is identifying dangerous
turning behaviours at junctions
Are dangerous movement patterns occurring at a junction intersection?
Client: Sutton Council / South London Partnership
Primary datasets: Turning Counts
Process
Sutton Council are using VivaCity Turning Count data to monitor illegal movements on one-way streets, on roads within restricted hours and junctions where there are ‘no right-turns’, to quantify dangerous movements that put other road users at risk.
Data-led decision making
Junction behaviour insights can help direct road safety investment by identifying junctions that pose a risk to vulnerable road users based on movement patterns across the intersection. The specific scenarios that heighten risk can be analysed in order to direct targeted road safety strategy and interventions.
6
Pedestrian path data is guiding future walkability-focused infrastructure design
How can we provide safer and strategic pedestrian crossings on School Streets?
Client: West Sussex County Council
Primary datasets: Tracks (paths); strategic Count lines
Process
West Sussex County Council are monitoring the use of new walking and cycling infrastructure by using path data to visualise pedestrian desire lines across roads. Sensors are located near a school where the current layout only includes a traffic island for people to cross, with no traffic lights or zebra crossings.
Data-led decision making
Pedestrian behaviours and crossing path insights will be used to guide future walking infrastructure investment. This data enables user-centred design decision-making, helping the council to make the road network safer for active travel.
7
Near Miss and Yield Analysis captures the impact of non-prescribed zebra crossings
How can we measure the road safety impact of non-prescribed zebra crossings?
Client: Welsh Government
Primary datasets: Near Miss; Yield Analysis
Process
By combining Near Miss and Yield Analysis datasets, Welsh Government are deploying 6 VivaCity sensors across Cardiff to capture vehicular and pedestrian interaction insights occuring at non-prescribed zebra crossings inside newly designated 20mph zones. This data will determine if vehicles are yielding to pedestrians who are waiting to use the crossing. Continuous 24/7 monitoring means that these datasets can be correlated with vehicle types, times of day or days of the week to bring further depth to the findings.
Data-led decision making
With data-backed evidence of how non-prescribed zebra crossings are being used in 20mph zones, the Welsh Government will be better placed to determine the best locations for further crossings, and identify if other interventions are needed to improve pedestrian safety.
8
Speed and path data reveals the road safety impact of contraflow cycle lanes
Do contraflow cycle lanes make city centres safer for cycling?
Client: Monmouthshire County Council
Primary datasets: Classified Counts; Tracks (paths)
Process
VivaCity sensors along the contraflow cycle lane capture modal counts, paths and speed data to understand how many cyclists are using the cycle lane and the direction of travel. Data from the same sensors also show if narrowing the road to make way for the cycle lane has impacted vehicle behaviours and speeds.
Data-led decision making
These data insights make it possible for Monmouthshire to assess the impact of the cycle lane on cyclist safety and active travel uptake, and will play an important part in future cycling infrastructure decision making. These findings will guide future cycling infrastructure.
9
Multimodal data identifies Liveable Neighbourhoods’ road safety impact
Monitoring the impact of low traffic neighbourhoods on active travel uptake
Client: Hounslow Council
Primary datasets: Classified Counts; Tracks (paths)
Process: VivaCity sensors have been used to capture multimodal road use data before and after the introduction of a one-way system and School Street hours extension to assess how Liveable Neighbourhood interventions have impacted active travel in the area.
Data-led decision making: Collated data enabled the council to establish a benchmark and objectively assess if the traffic measures were achieving active travel objectives. These insights play a critical role to experimental traffic scheme decision-making.
10
Data insights show how School Streets affect active travel behaviours and safety
Evidencing the impact of School Streets on pupils’ safety
Client: Cross River Partnership
Primary datasets: Classified Counts; Tracks (paths)
Process
Hackney Council and CRP are monitoring School Streets in two areas to assess their impact of restricted vehicular traffic on cycling and walking levels and behaviours.
Data-led decision making
This data has been used to demonstrate the impact of temporary restrictions and can be used to understand what effects School Streets have on the environment and how children travel to school.
How does our technology achieve this level of data-insight?
What makes VivaCity the market-leading computer vision traffic monitoring solution?
Discover the key ingredients:
The real value of monitoring data isn’t the data itself.
It’s what you do with it.
VivaCity data insights can support your road safety every step of the way, from inception to delivery.
Baseline data
Gain insights into Near Miss incidents before the introduction of a road safety intervention.
Baseline data will supporting decision-making when developing the intervention or scheme, leading to a strategic investment with clear predetermined goals.
Compare this pre-implementation data with post-implementation data to assess its success.
Long-term and real-time data
Access historic and real-time data to identify how behaviours have been impacted by road safety interventions, whether that’s segregated cycle lanes, the introduction of 20mph zones or junction and pedestrian crossing re-design.
Comprehensive quantitative data
Use highly accurate, multimodal quantitative data to support funding applications.
Data is an excellent evidence-based resource that will demonstrate your ability to monitor and evaluate road safety scheme performance effectively.
Data-backed decisions and evidenced results
Communicate the reasons for and impact of road safety interventions to local communities and stakeholders with credibility and clarity.
Discover more of our work and how we’re supporting local authorities and transport bodies with data insights.
Case studies
Want to discuss your upcoming project or funding bid with us?
We’d love to hear from you.
Like our content? Sign up to our newsletter and receive the latest updates in your inbox.
Sign-Up