One of the frustrations with the analysis of air quality data is the lack of representative vehicle activity data. Such data has the potential to generate useful information on source apportionment and hence provide insights into the most effective mitigation measures that should be considered to understand urban air pollution and improve air quality.
This blog has been written in partnership with Ricardo, a global engineering, environmental and strategic consultancy, and looks at how new types of traffic measurement data can be used with vehicle emission remote sensing data to better understand the contributions made by different vehicle types to urban NOx and NO2 emissions and concentrations. The reduced traffic experienced throughout several lockdowns over the past year has provided a unique opportunity to investigate these issues in more depth and quantify the effect on ambient concentrations of NOx and NO2.
During 2020, we supported the Department for Transport’s national initiative to monitor the impact of Covid-19. This blog makes use of this data set, but for the first time combines it with national air quality monitoring data, enabling new conclusions to be drawn on the impact that the 2020 lockdowns had on the sources of air pollution.
A selection of 440 sites has been used to provide a national view of traffic trends in the UK, including 10 cities, a major trunk road and a number of rural locations. In total more than 800 million traffic movements are included in this analysis across the 13-month period. The data set covers city centres, local centres, residential roads, business and retail parks and urban and rural green spaces.
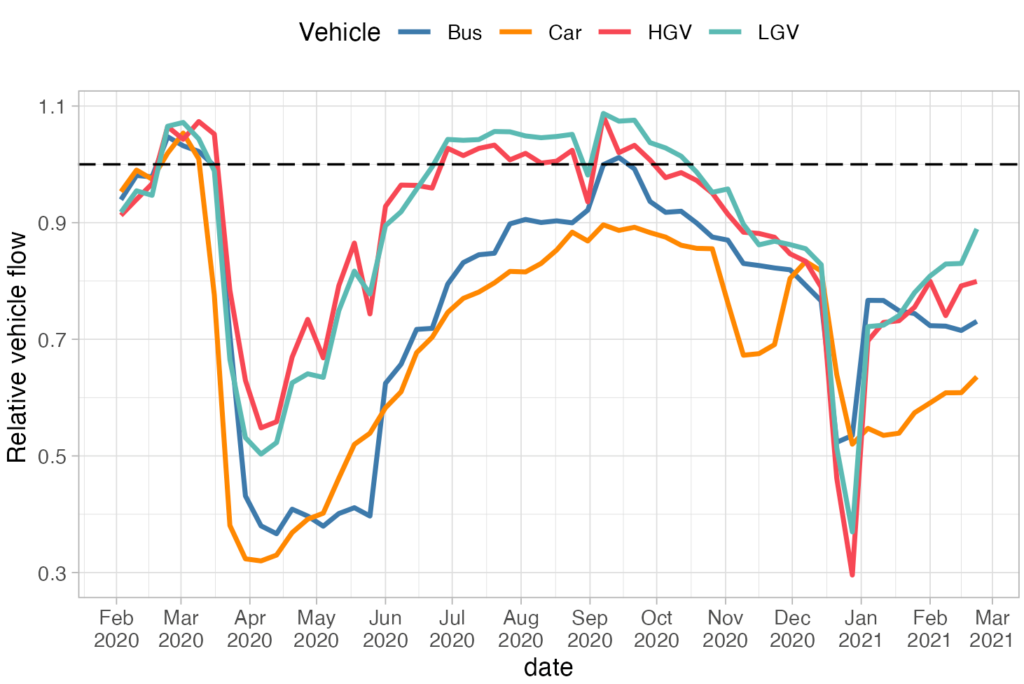
Figure 1 Normalised trend in the flows of different vehicle types over one year since February 2020 based on VivaCity sensor vehicle measurements. The data have been normalised such that the average flow over the period February to 16 March 2020 is set to a value of one.
The detailed traffic information can be combined with Ricardo’s vehicle emission remote sensing measurements[1] to provide information on the contribution made by different vehicle types to urban NOx emissions. The results are illustrated in Figure 2, showing that passenger cars contribute almost 60% of the total NOx emissions – as well as highlighting the impact of buses, which contribute 17% of the total for pre-lockdown condition emissions.
These numbers gloss over a huge amount of important detail. For example, the emissions represent the real-world performance of in-use vehicle fleets measured across a wide range of urban areas in the UK in terms of fuel type, vehicle age, emissions control technology and mileage split. They also provide evidence of emissions under real driving conditions incorporating the effects of factors such as changes in ambient temperature and any deterioration in engine or after-treatment technology. The data also provide a consistent measurement of emissions from a large range of vehicle types from motorcycles through to HGVs and buses and coaches. In other words, the emissions data is ideal for these purposes (source apportionment) and ought to represent the most robust way of quantifying the contribution made by vehicles to emissions of NOx. In addition, the remote sensing data presented here has now been used to translate individual vehicle measurements through to estimating national totals (Davison et al., 2021).
During the lockdown periods over the past year, the contributions from different vehicles changed. The passenger car contribution decreased to 53% and LGVs and HGVs together contributed just under a third of the total NOx, which is seen more clearly in Figure 1.
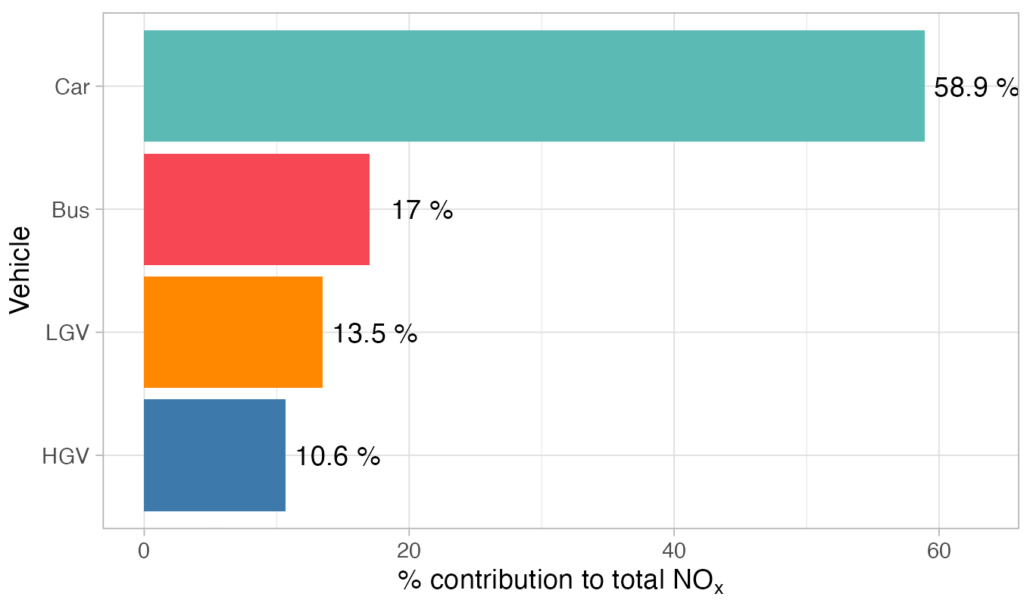
Figure 2 Estimated emissions contribution by main vehicle type in urban areas based on combining VivaCity sensor measurements with Ricardo vehicle emission remote sensing measurements.
The relative apportionment of NOx emissions by vehicle types is shown in Figure 3, which highlights the very clear reduced NOx emissions during the first lockdown – but also the continued reduced emissions in late 2020 and into 2021. The vehicle measurement data strongly suggest that even in late February 2021 vehicle flows remained well below typical values, which translates to lower overall NOx emissions as shown in Figure 3.
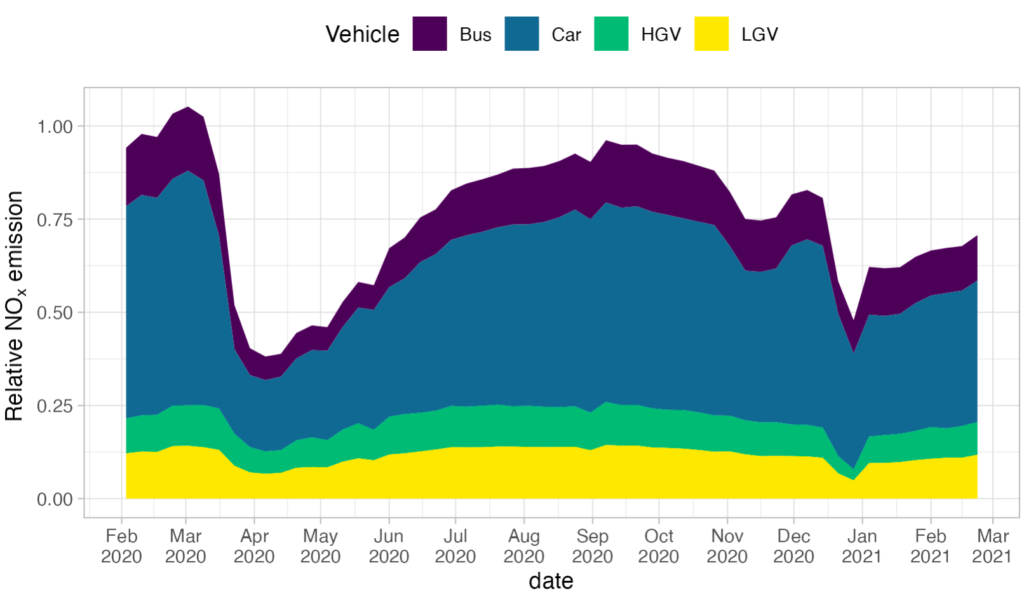
Figure 3 Trend in calculated emissions of NOx since February 2020, split by main vehicle type.
The trend in traffic NOx emissions can be compared with the ambient measurements of NOx and NO2. Figure 4 shows how concentrations of NO2 deviated from expected values using the counterfactual approach highlighted in Ricardo’s first blog (Grange and Carslaw, 2019). This modelling covers more than 70 urban traffic and urban background sites and aims in this case to provide an overall average urban NO2 change over the past year. What is clear from Figure 4 is how well it corresponds to the changes in traffic shown in Figure 3 – and confirms the continued lower than normal concentrations throughout the early part of 2021. It should be noted the large decrease in later December 2020 is more in line with expected behaviour because of lower levels of traffic over the Christmas period. Even though this analysis provides an aggregated view of changes in emissions and concentrations, it has the benefit of reducing the influence of specific, very localised changes seen in the air quality measurements, to provide a representative view of the response in urban areas in general.
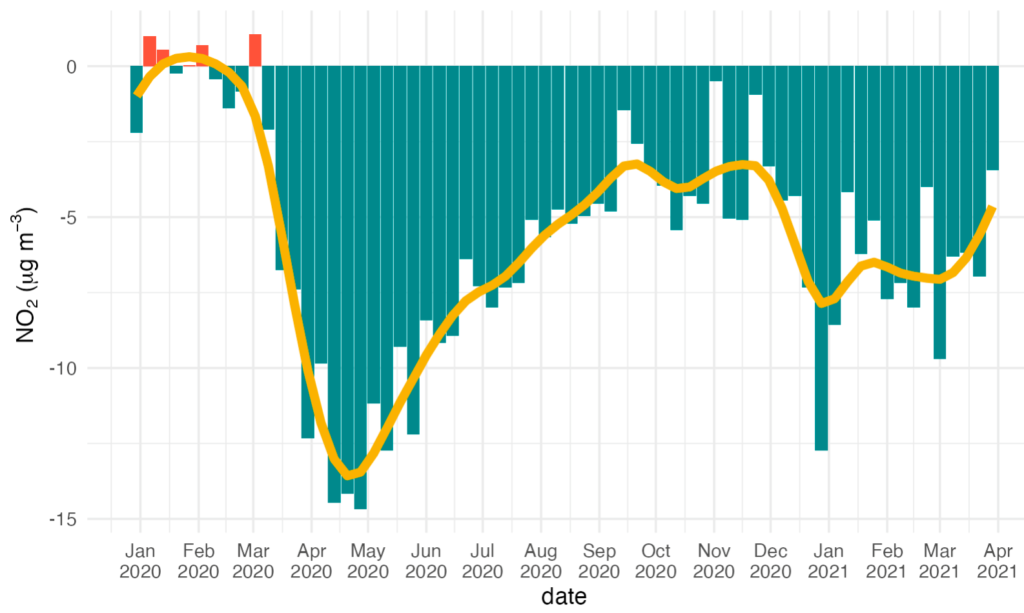
Figure 4 Deviation in average NO2 concentration based on the analysis or urban roadside and background air pollution measurements sites. The yellow line shows the smoothed trend.
It is possible to go one step further with the analysis and combine the weekly changes in concentrations of NOx with the weekly changes in emissions of NOx shown in Figure 3. Combining the two data sets reveals a close to linear relationship between the average change in NOx concentration and the relative emission of NOx – seen in Figure 5.
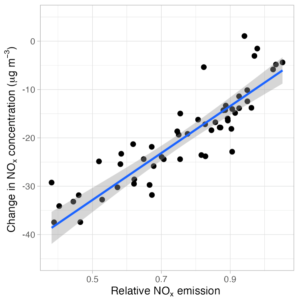
Figure 5 Relationship between the relative change in traffic emissions of NOx and the corresponding ambient concentration of NOx based on weekly averaged data.
The information in Figure 5 can be used to estimate the average urban contribution road vehicles make to NOx and NO2 concentrations. Overall, it is estimated that road vehicles contribute to 77% of urban NOx concentrations and about 66% to NO2 concentrations. There is a difference though between roadside and urban background locations, with roadside locations seeing a 78% contribution of NOx concentrations from road vehicles and urban background sites seeing a 55% contribution. These results highlight the continuing importance of road vehicles in terms of their contribution to NOx and NO2 concentrations – and emphasises the need to further reduce emissions, even after decades of increasingly stringent emissions control.
The next step will be to consider changes in specific urban areas, which should help provide valuable information on the factors that control pollutant concentrations – and hence provide important information on how best to reduce the air pollution burden in our cities.
References
Davison, J., Rose, R. A., Farren, N. J., Wagner, R. L., Murrells, T. P., and D. C. Carslaw (2021). Verification of a National Emission Inventory and Influence of On-road Vehicle Manufacturer-Level Emissions, Environmental Science & Technology, https://doi.org/10.1021/acs.est.0c08363.
Grange, S. K. and Carslaw, D. C. (2019) ‘Using meteorological normalisation to detect interventions in air quality time series’, Science of The Total Environment. 653, pp. 578–588. doi: 10.1016/j.scitotenv.2018.10.344.
Grange, S. K., Lee, J. D., Drysdale, W. S., Lewis, A. C., Hueglin, C., Emmenegger, L. and D. C. Carslaw, (2021). COVID-19 lockdowns highlight a risk of increasing ozone pollution in European urban areas. Atmospheric Chemistry and Physics, 21, 4169–4185, https://doi.org/10.5194/acp-21-4169-2021.
[1] Around 0.5 million vehicle measurements at the time of writing.
Visit our technology page to find out more about how our AI powered traffic sensor solution can help you understand road traffic and its contribution towards urban air pollution – get in touch with out team now.
Like our content? Sign up to our newsletter and receive the latest updates in your inbox.