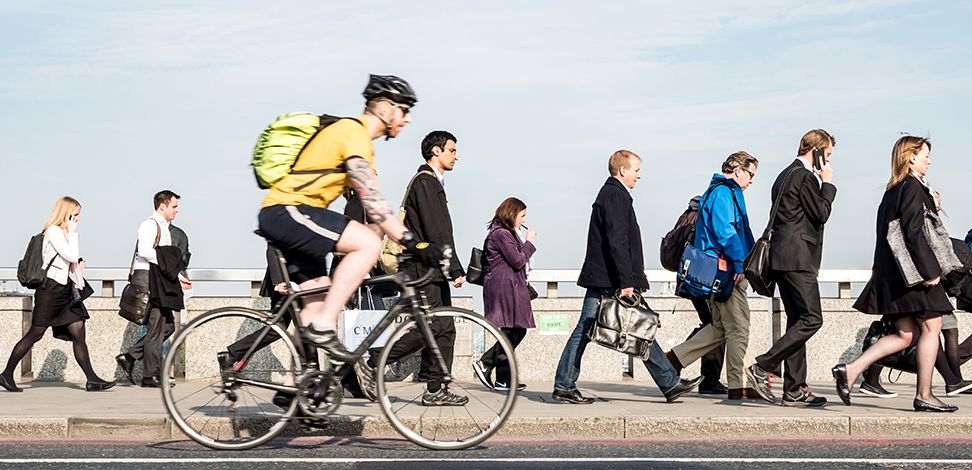
Widespread modal shift from motorised vehicles to active transportation and micromobility is sweeping across the country. Quantifying this shift to better understand urban travel and optimize the road network accordingly requires intelligent traffic monitoring technology. AI-powered computer vision technology is the go-to tech for the job.
Download Free Report: The Impact of the Pandemic on Active Transportation in 2021
In this article we provide key insights and learnings gathered from our work to date with local authorities and network planners, and take an in-depth look at how computer vision technology is revolutionising the traffic monitoring industry.
We will explore:
- Evidencing modal shift with AI-powered computer vision tech
- Modal shift in the aftermath of the pandemic
- Your modal shift questions answered
- The value of modal shift monitoring and assessment
- Case studies
We hope that the information here will help you to make informed decisions about the technology you specify to measure and evaluate modal shift and assess the impact of active transportation schemes.
Evidencing modal shift with AI-powered computer vision tech
Computer vision has become the go-to technology for traffic monitoring, but not all AI-powered CV tech is created equal. There is a growing choice of traffic AI tech available on the market, varying in accuracy and usability, and the crucial ability to adapt to the rapidly increasing range of transport modes using the road network.
What’s more, many cheaper, entry level solutions are exposed to GDPR risk, with post-processing of video a common approach. This means that not only are the capabilities of real-time data lost, but worse, personal data in imagery will often be sent to multiple systems.
So how to decide on what tech to specify?
We’ve presented some of the key differentiating factors to consider below.
Accuracy: the journey to expertise
For data to be meaningful it must be accurate, and when it comes to traffic, accurate data is most meaningful when it’s the product of continuous long-term monitoring.
AI technology learns how to identify objects much like humans do. When we’re learning to recognise anything, the more exposure to affirmed examples we have access to, the more quickly, confidently and accurately we are able to identify them ourselves.
To develop a high performing machine learning algorithm requires vast quantities of labelled training data – images of correctly identified road user types. Over time the algorithm learns the characteristics of different road user types and is able to detect and classify itself. Accuracy can be maximised via reinforcement learning – a training method based on rewarding desired behaviors (accurate counts, accurate classifications) and penalising undesired behaviors (counting an object that isn’t present, misclassification).
It’s often quoted that it takes 10,000 hours of practice to become an expert at something. At Viva we’re working with over 100 Local Authorities across the country and have deployed over 4,500 sensors. Our machine learning database is massive (and only continues to grow). Viva algorithms undergo extensive training, utilising c.1m annotations of images, and each installation of an individual sensor is meticulously validated and calibrated over its first two weeks of operation.
This is how we’ve achieved an independently validated, market-leading accuracy rating of 97%.
Validation: from the ‘classroom’ to the ‘real-world’
Every time a sensor is installed it is remotely validated before being given the green light to begin data collection. Every location is slightly different. When scoping the locations of sensors it’s important to consider factors such as elevation angle, light levels and angle of rotation relative to the road, and specify the type of lens which enables the highest level of data accuracy, depending on the use case.
To make sure that the algorithm is performing as it should, we run a script to capture a short video. This is reviewed to make sure that the position of the lens is optimal for accurate detection and is capturing the areas of the road space required by the customer for their specific business case. Countlines and Zones can be tweaked remotely to maximise accuracy and efficiency.
Datasets and Capabilities
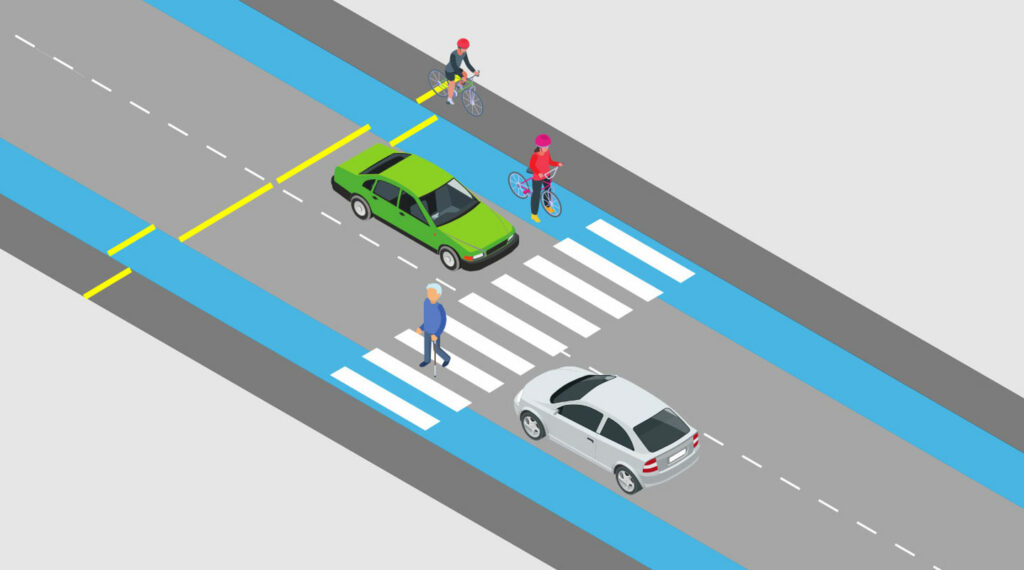
Advancements in computer vision and Machine Learning technology have made it possible not only to detect and classify the presence of cyclists, pedestrians and other micro-mobility modes, but to also track their paths across the road space. This enables accurate assessment of modal share across the road network, as well as insights into behaviors, speeds, interactions between road users and potential accident hotspots.
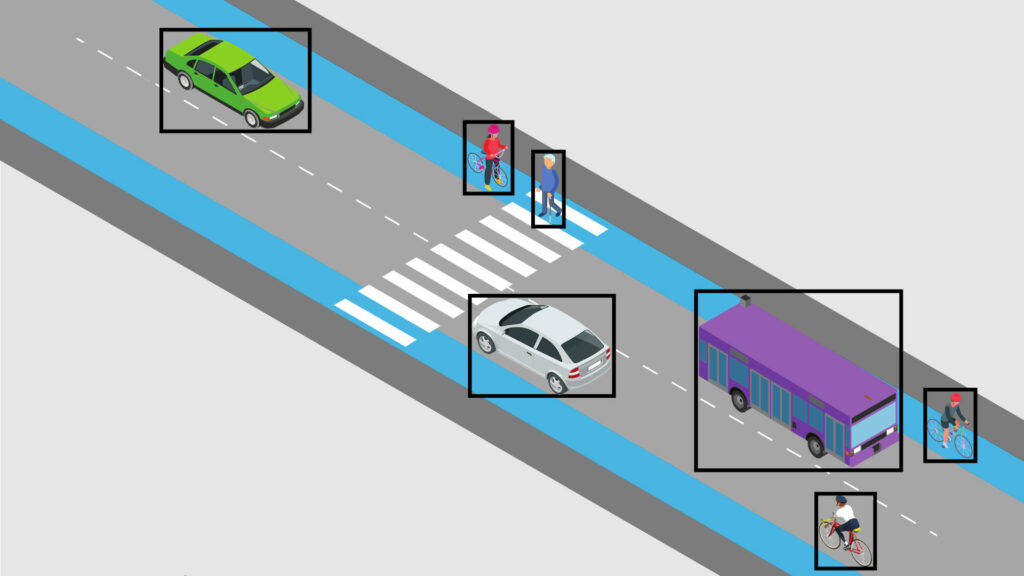
Detection
This is the basis of computer vision detection, where the presence of objects can be detected. From there, further analysis is possible.
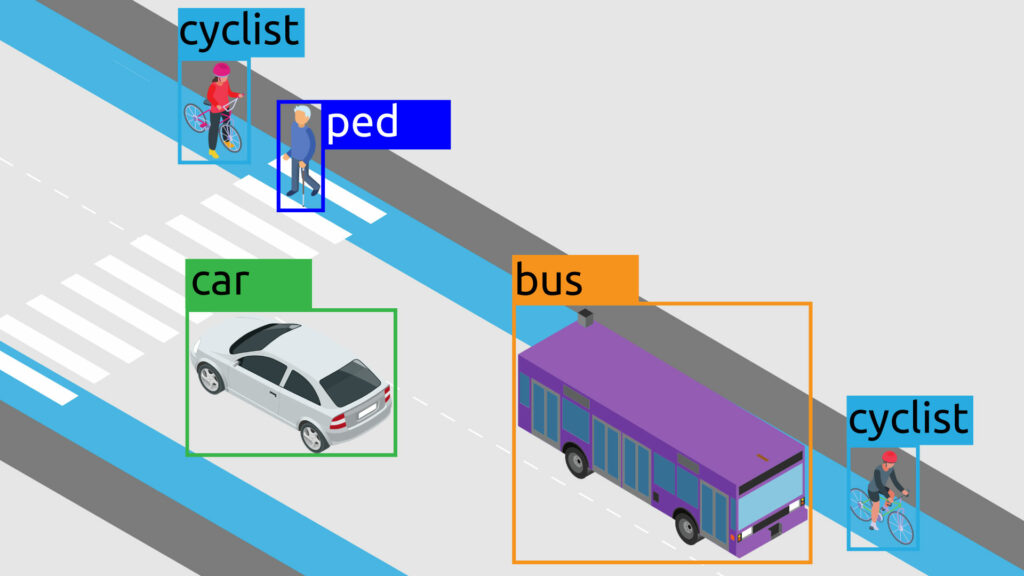
Classified Counts
The most advanced computer vision technologies can detect a broad range of road user types, including pedestrians, bicycles (pushbikes, cargo bikes, e-bikes), e-scooters, cars, taxis, vans, buses, HGV1 and 2, with 97% accuracy.
They are also able to learn how to detect new road user types as they appear on the network.
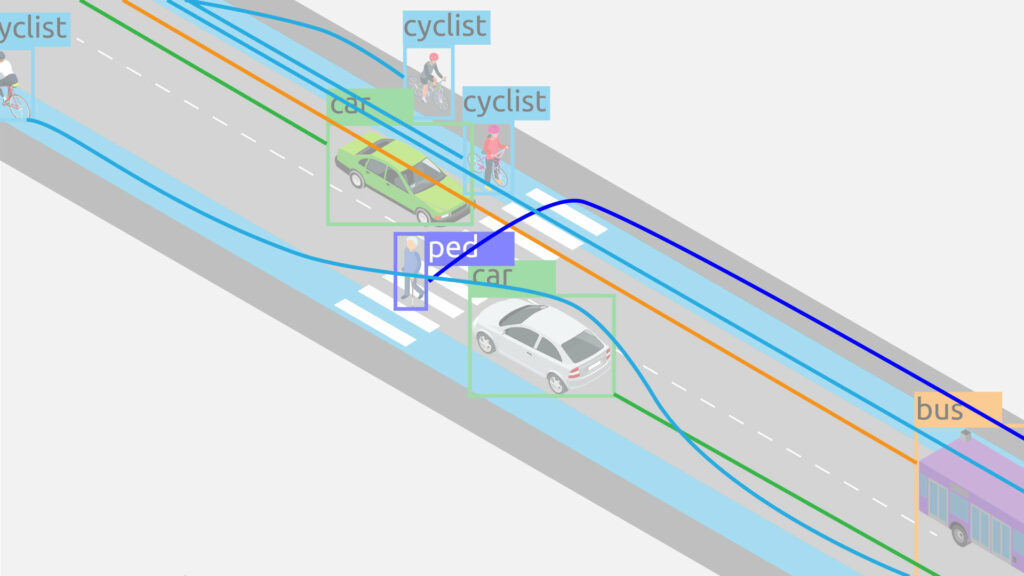
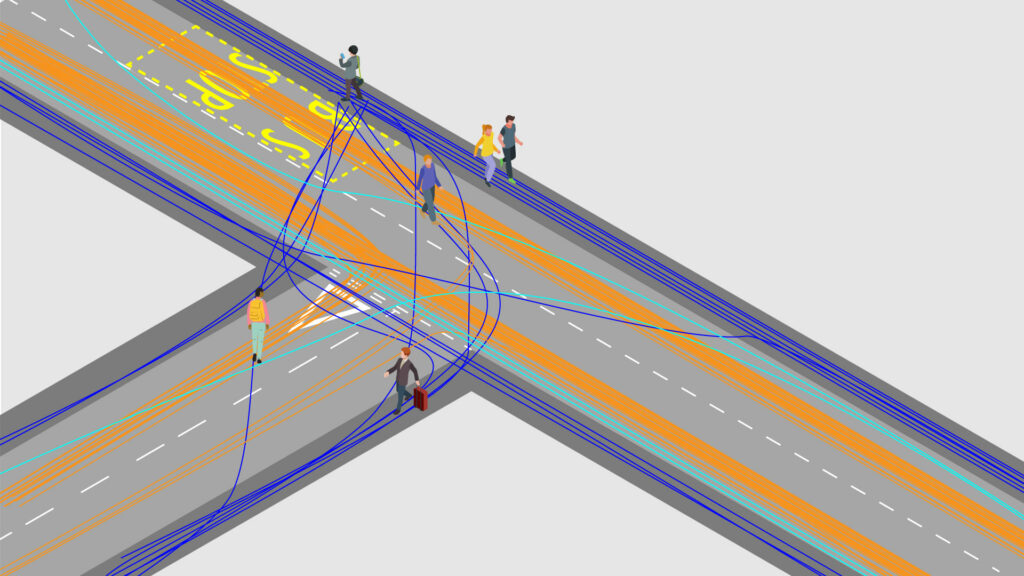
Tracks (path)
Tracking the paths objects take across the sensor’s field of view offers a clear understanding of the usage of precise spaces within an environment. Colour coding for aggregate road user categories helps to maximise the legibility of the data.
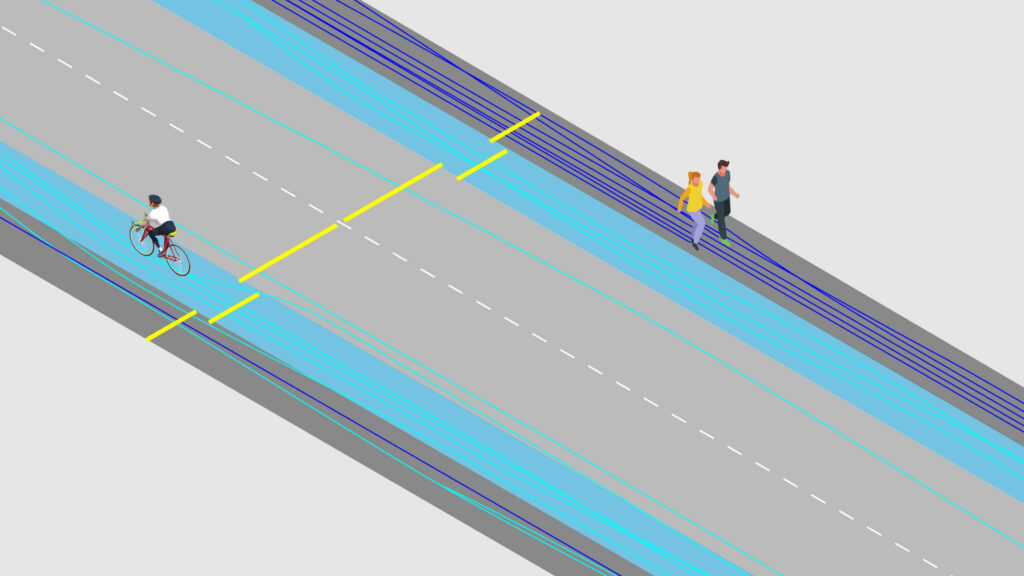
Virtual Countlines
Countlines are a really useful feature offered by some computer vision technology providers. Countlines can be placed anywhere in the sensor’s field of view to count classified road users as they cross the virtual line, and in what direction. Countline Speed is the speed of every object of each class that has crossed a countline over a 5 minute bucket. This a feature to assess speed distribution.
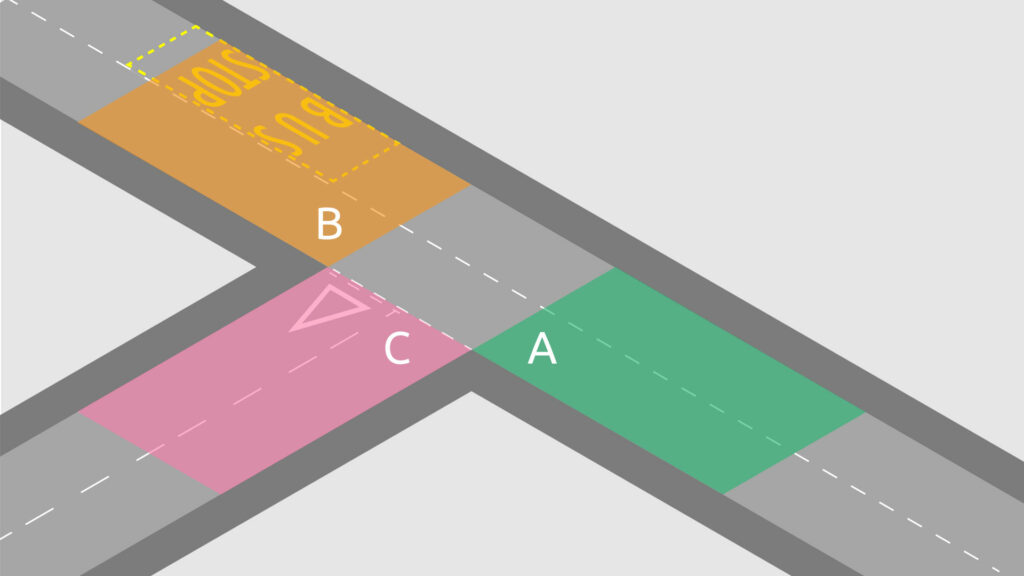
Zones and Turning Counts
Zones can be placed anywhere in the sensor’s field of view. Zonal Speed is the average speed of every object of each class within a zone at each second averaged over 5 minute buckets. Zones around a junction can be used to gather Turning Counts, triggering as classified road users cross into one zone from another. This features supports the understanding of junction operation and can identify safety risks.
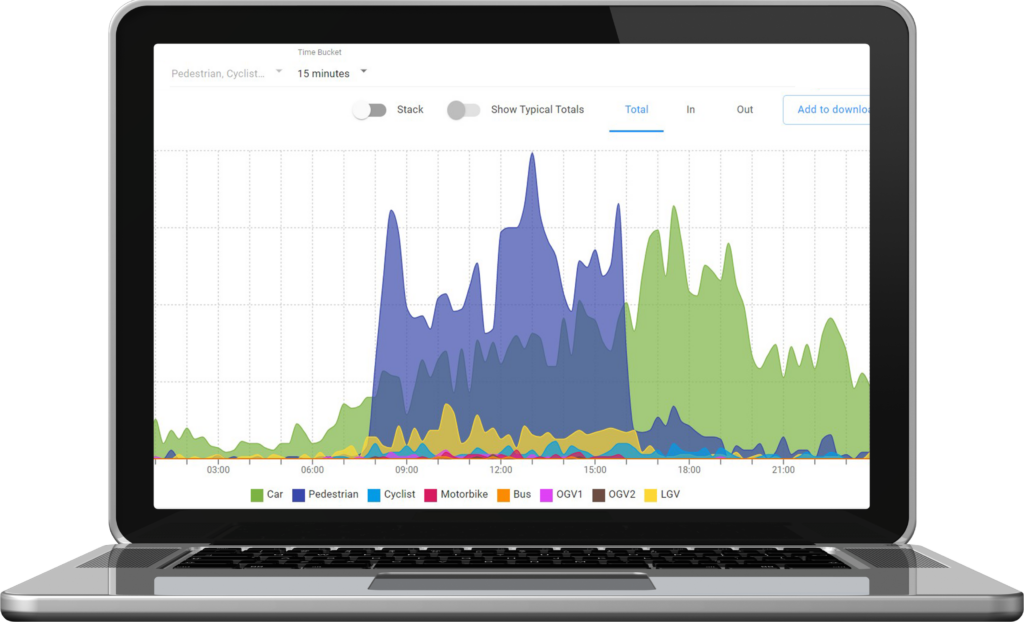
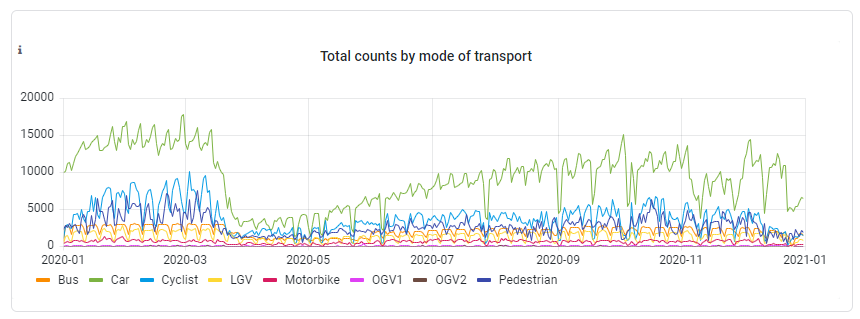
Data visualisation via the Dashboard
Graphs, tables and images can be viewed and downloaded for further data analysis and insights. For increased accessibility, data can also be integrated into in-house systems via API.
A computer vision sensor image
A blur is applied to avoid personal identification and preserve privacy. Only anonymous features are stored and the video frame is deleted.
A low-res, blurred sensor image or video clip can be requested to help understand abnormal behavior identified in the live data feed.
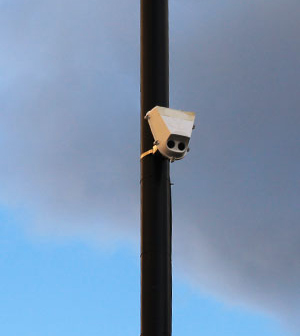
Installation process
An AI-powered computer vision traffic monitoring sensor is typically a small, lightweight, metal box that attaches onto a lamppost or other tall street furniture which houses a processor and an inbuilt camera. The sensor is installed high above ground to achieve an unobstructed field of view of the road space.
This means that installation is quick, causing minimal disruption and noise. In the case of our sensor, each frame of video is analysed by a Machine Learning algorithm to extract the location and classification of each road user, and then immediately deleted. Only anonymous data is extracted and transmitted via the Cloud to the client.
Data security
To be useful, data needs to be easily accessible.
- The ease with which data can be accessed is a crucial element of a solution’s design. A cloud-based dashboard that enables clients to log in from anywhere and view live and historic sensor data with multiuser logins will maximise accessibility and usability of data. Solutions that provide access to live and historic data via an API for 3rd party system integration enhances accessibility further.
Sensor images can also be retrieved by users for further analysis. GDPR means that immediate, automatic and on-device blurring of personal data must take place.
To be responsible, data needs to be secure
- Data security is another key requirement. It’s vital that data is fed securely from the sensor to a cloud server for storage and backup.
Security of personal data on the device is also crucial. GDPR risks mean that it’s essential that video is processed on-device, in real-time and disposed of immediately, to ensure only non-personal data is communicated.
To be ethical, data needs to be anonymous.
- Accurate data on the usage statistics of road environments must be provided in a completely anonymous way and AI technology should use data protection-by-design principles to ensure full GDPR compliance. No personal data should be collected.
At Viva, none of our clients can use our technologies to gather any kind of personal data or identification for enforcement purposes, ever.
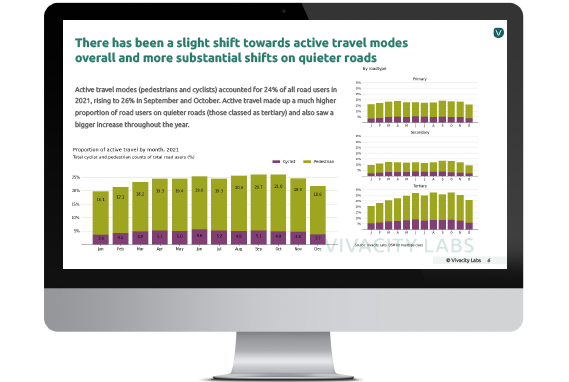
Modal shift in the aftermath of the pandemic
The pandemic installed societal anxiety around public transport and a desire for low risk options, resulting in an increase in private vehicle use and cycling.
In response to the dramatic rise in cycling volumes, many local councils built pop-up cycle lanes, whilst others installed modal filters to make roads safer and more inviting for cyclists and pedestrians, or widened pavements overnight to cater for social distancing rules.
‘Tactical urbanism’, typically low-cost, scalable, and initially short-term, interventions, were implemented in response to modal shift and continue to nurture it, with many short-term pieces being made permanent.
The Impact of the Pandemic on Active Transportation in 2021
Learn more about the pandemic’s impact on modal shift in our recent report
Your modal shift questions answered
AI-based computer vision technology is a game changer for traffic monitoring. The ability to gather accurate, long-term multimodal data insights make it the monitoring technology of choice for evidencing modal shift.
Here’s some useful examples that demonstrate the advanced capabilities of computer vision technology in the context of traffic monitoring:
Q1: Is the recently built protected cycle lane or widened pavement resulting in more walking and cycling? Is this in turn reducing the volume of motorised traffic?
Multiple virtual countlines can be used to answer this question. We would suggest placing one across the road way, one across the cycle lane and one across the pavement. The data will show the volume of cyclists using the different elements of infrastructure. It can also reveal correlations between the volume of pedestrians when cyclists are using the cycle lane compared to when they’re on the pavement. Using the speed feature may also be helpful to understand if there’s a correlation between cyclists choosing to use the pavement because of excessive vehicle speeds, making the cycle lane seem unsafe.
Q2: How can I make crossing a road safer for pedestrians to increase the walkability of my area?
The first call is to aggregate total volumes of pedestrians within an area using classified counts, to assess if a crossing may be needed. Our paths feature can help identify pedestrian desire-paths and inform the optimal location for a formal crossing. Alternatively these paths could be used to develop infrastructure that prevents jaywalking in high-risk areas. Sensor data can also be integrated into urban traffic control systems to facilitate optimized multi-modal signalling that gives priority to pedestrians upon demand.
Q3: I want to know the current level of active transportation in the Borough to understand where more interventions are needed to increase this further. What sensor features will help me with this?
Our classified counts feature provides the data you need to ascertain the current level of active travel, providing 24/7 counts of pedestrian and cycling activity. You’ll also be able to see if there are any correlations between the time of day or week and active transportation volumes with the Trend Analysis tool.
Installing multiple sensors across the Borough to capture volumes of cyclists where there are segregated cycling lanes compared to locations where there are none, will indicate the impact of such infrastructure on uptake. In addition, the Intervention Analysis tool will help you get the most out of your pre- and post-implementation data to evidence the success of active transportation schemes and interventions going forward.
To maximise the impact of further infrastructure investment, we would recommend analysing cyclists paths to understand the most popular routes. Once identified, you may then consider introducing timed restrictions on vehicle access to encourage more active transportation along these proven routes.
To enhance active transportation volume data, you can analyse Countline and Zonal Speed for insights into how traffic speed impacts active transportation. This insight can guide speed reduction interventions, whether through new speed limits or road layout and design.
Near Miss data will highlight areas of the road space where cyclists and pedestrians are particularly vulnerable to accidents. You can use this data to initiate road safety enhancements at these hotspots to make roads safer for active transportation and encourage uptake.
Aside from infrastructure investment, another way to encourage more active transportation is to shout about its (data-backed) benefits. For example, along some routes travelling by bike might be much faster than by car. Use the speed analysis features to evidence this and spread the word!
Q4: How related is modal shift to good weather?
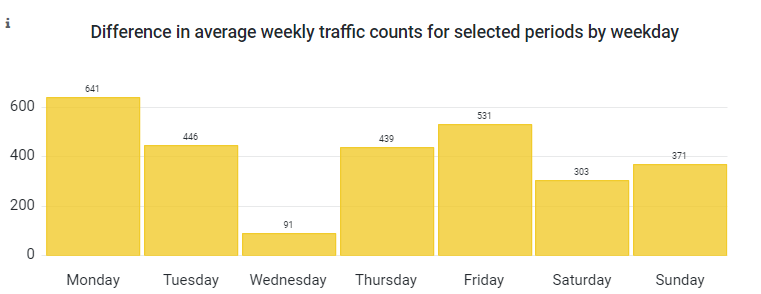
Historic classified count data for pedestrians and cyclists can be analysed against weather data. The same method can be applied to identify if there are particular days of the week that witness greater levels of active transportation.
We’ve explored the impact of extreme weather events on pedestrian and cycling activity along Wimbledon High Street, London. Read the case study here.
You can also correlate classified count data with air quality monitoring data, to see the impact of modal shift on the environment.
The value of modal shift monitoring and assessment
Critical to successful funding bids
Comprehensive, accurate data is essential for the credible evaluation of any kind of improvement scheme. The Government places great emphasis on high-quality evaluation, as outlined in the Department of Transport’s (DfT) Monitoring and Evaluation Programme 2021. To be successful in any funding bid, bidders need to demonstrate a strong monitoring and evaluation approach.
Browse the list of Government funds related to modal shift that are currently accepting bids from local authorities and transport organisations below:
The real value of monitoring data
The real value of monitoring data isn’t the data itself, it’s what you do with it. Data can support your modal shift scheme across different stages of the project in a variety of ways.
- Baseline data - Gain insights into the volume and types of road users, including active transportation and micromobility modes, before a modal shift focused intervention. Baseline data will help your decision-making when developing the intervention or scheme, leading to a strategic investment with clear predetermined goals. Compare this pre-implementation data with post-implementation data to assess modal shift following implementation.
- Long-term and real-time data - Access historic and real-time data to identify modal trends, anticipate network demand and assess performance.
- Comprehensive quantitative data to support funding applications - Demonstrate your ability to monitor and evaluate modal shift and active scheme scheme performance effectively.
- Data backed decisions and evidenced results - Communicate the reasons for and impact of modal shift and active transportation schemes to local communities and stakeholders with credibility and clarity.
Download Free Report: The Impact of the Pandemic on Active Transportation in 2021
Case studies
Browse a selection of case studies and other resources to learn more about how we work with local authorities to help them get the most out of their funding and maximise the potential of their projects:
- Merton Council is monitoring high street health after Covid restriction lifting
- Abergavenny Uses Viva Sensors to Monitor Contraflow Cycle Lanes
- The London Borough of Hounslow is using Viva data insights to support Liveable Neighbourhoods Scheme
- Sustainable travel innovations with Liverpool John Moores University
- School Streets Monitoring by the Cross River Partnership Viva Programme
- Cross River Partnership Proof of Concept of ‘Al Fresco’ Dining in Soho
Want to discuss your upcoming project or funding bid with us? We'd love to hear from you.
Get in touch here.
Like our content? Sign up to our newsletter and receive the latest updates in your inbox.
Sign-Up