In 2020 the UK experienced a ‘bike boom’. At the start of the pandemic, bike sales surged, suppliers struggled with demand and traffic data recorded an increase in cyclists. In addition to existing funding, the government launched an emergency active transportation fund in May 2020 to support local councils to make their roads more cycle friendly. Since then, many, including Bristol City Council, have introduced new cycle infrastructure or measures to reduce motorised traffic.
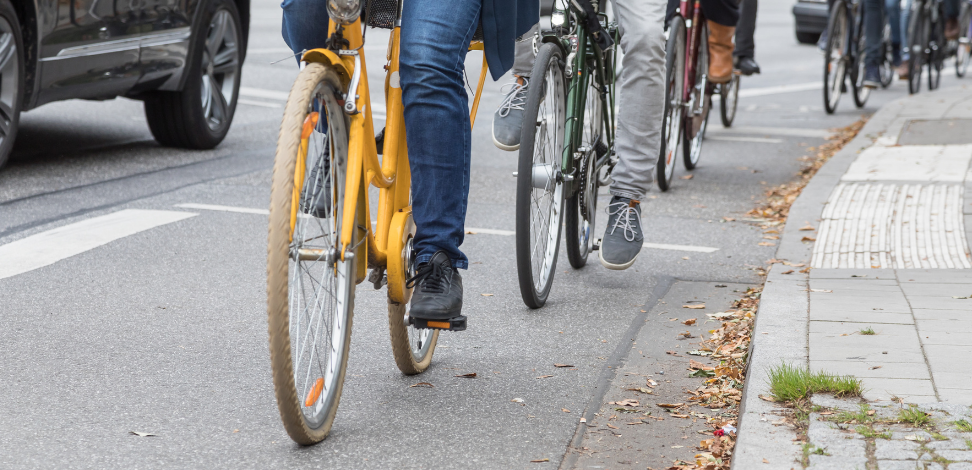
National data suggests the way people travel is changing with more choosing to cycle
With the Covid-19 pandemic, much of the country came to a standstill. While motorised traffic volumes dropped significantly, national data suggested an uptake in cycling in terms of number of people cycling, trips made and distance travelled.
In 2020, the proportion of people cycling at least once a week in England rose from 11% to 12%, with some of the biggest increases recorded in London. Conversely, cycling rates fell in Bristol likely due to a fall in commuter cyclists as a result of work from home guidance. Although the rate of cycling decreased in Bristol, the figure remained much higher than the national average in 2020.
Bristol City Council tested and implemented schemes to improve walking and cycling routes in summer 2020
In August 2020, Bristol City Council closed Bristol Bridge – which serves as a major gateway into the city centre – to general traffic. It was part of a wider campaign to improve air quality and make it easier for people to use public transport, walk and cycle. During the trial period, the council monitored traffic volumes within the city centre and boundary areas, air quality and bus journey times. In January 2021, six Viva traffic monitoring sensors were installed to support an in-depth evaluation before road changes became permanent in July 2021.
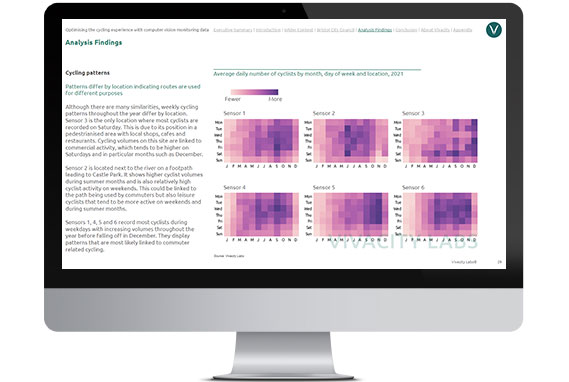
Viva sensor have helped better understand cycling behavior
Cycling levels grew following the easing of Covid-19 restrictions with new highs recorded in spring 2022
Classified cyclists counts recorded per day show a continuous increase from January 2021 in line with the easing of restrictions. During this period, cycling levels rose much faster than cars but were also more volatile (see full report). Between July and December 2021 the number of cyclists was fairly stable, before falling during Plan B restrictions and the Christmas season. In spring 2022 levels rose again, peaking on 23 March with a record of 11,300 cyclists compared to a daily average of 6,500 for the whole period.
Bristol Bridge records most cyclists connecting key routes through the city
Mapping hourly data by location provides useful insights into cycling flows on key routes. Sensor 1 and 2 - located next to the Bristol Bridge - recorded the highest levels of cyclists on weekdays in 2021. Serving as a major connector, an average of 441 cyclists crossed the bridge using the carriageway during the afternoon peak between 16:30 - 19:00. Sensor 4 gets notably busy during morning rush hour.
1 in 10 road users recorded are cyclists
Viva sensors are able to detect different types of road users allowing an analysis of modal distributions. Active transportation modes combined made up more than two thirds of road users, a reflection of the sensor locations. Two sensors (S2, S3) are in pedestrianised areas and sensor 1 monitors Bristol Bridge with restricted access to motorised traffic.
Cyclists accounted for 9-11% of road users each month. They made up a slightly higher share in early 2021 and lower during winter. Cyclists made up the smallest proportion of road users at sensor 6 (5%) while they account for 12% along the cycle lane at sensor 4.
Weather, local and national events impact cycling levels
A number of studies [eg. 1, 2, 3] have explored the impact of weather on transport and found cycling to be the most sensitive mode. Cycling levels tend to be lower in cooler temperatures but are also affected by hot days, rainfall and wind speed.
Mapping weather data for Bristol against cyclist counts shows that levels of cycling somewhat follow average temperatures. There are more cyclists when days are warmer but fewer when temperatures spike in July 2021. December 2021 sees a drop despite relatively mild weather, however, this is also linked to Plan B restrictions and the holiday season, similar to a drop during Easter 2022. Find more analysis on the link between weather and cycling in the full report.
Conclusion
With access to accurate, 24/7 multimodal road use data, Bristol City Council is developing a deep understanding of traffic flows, modal distributions and cycling trends such as daily and weekly patterns and where people cycle, eg. pavements, cycle lanes, carriageways.
The continuous monitoring will be used to plan and inform future interventions:
"The on-going Viva data capture facility on Bristol Bridge is being used to help the project rationalise the road space now available since the Bus Gate project became permanent.
The evidence base provided by the Viva sensors will help decision makers to make the right call about managing the many modes that use this important junction.”
Thor Sever, Project Manager, Bristol City Council
Optimizing the cycling experience with computer vision monitoring data
Discover how Viva monitoring data helped Bristol City Council build a business case for dedicated cycling infrastructure.
You might also be interested in:
Our Solutions | Viva Technology | Other News & Case Studies | About us
Like our content? Sign up to our newsletter and receive the latest updates in your inbox.
Sign-Up