Multimodal traffic surveys with long-term, real-time data
Viva: An innovative approach to traffic solutions
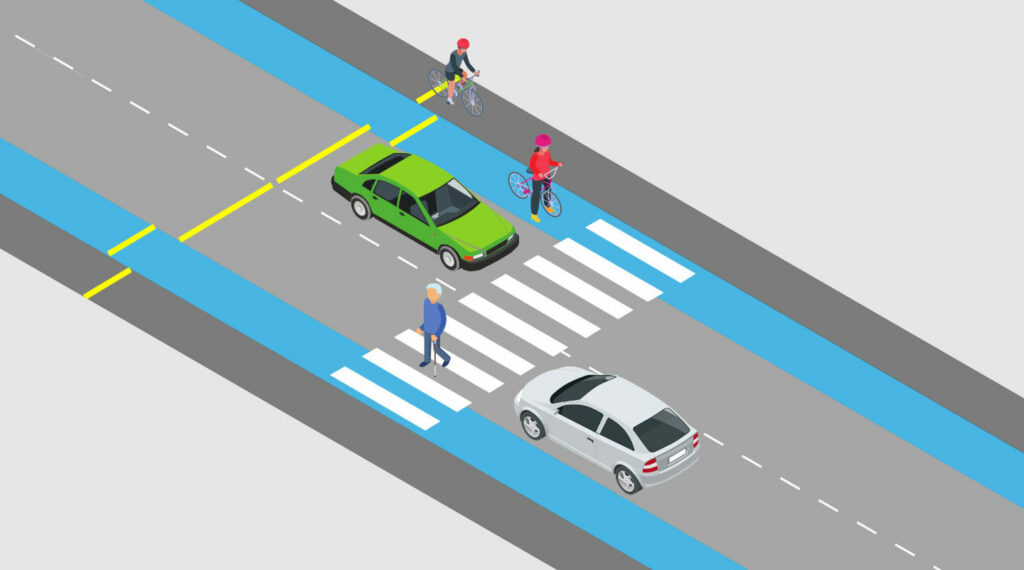
The advent of computer vision technology and advanced AI has transformed many industries, including transportation and the data collection methods for traffic surveys. Intelligent transportation solutions, like Viva sensors, have made it possible to capture much more granular and varied datasets on traffic movement.
As the variety and volume of transportation types increases, and with active and sustainable travel high on the agenda, comprehensive traffic surveys and monitoring data – and the insights they provide – are key to achieving major network goals.
A variety of traffic surveys from a single intelligent transportation solution
With Viva video analytics, authorities can carry out a variety of traffic surveys simultaneously. From a hyper-localised survey with a single sensor, to city-wide analysis with a 100+ sensor network, Viva is helping authorities across the world capture highly accurate, GDPR compliant road network data for transportation scheme monitoring and evaluation.
5 traffic surveys you can perform with Viva data
There are many useful traffic surveys you can carry out with Viva. The data can be explored in an online dashboard and downloaded as an API.
Here are 5 popular surveys that offer a range of insights to support sustainable and active travel, road safety improvements and network optimisation.
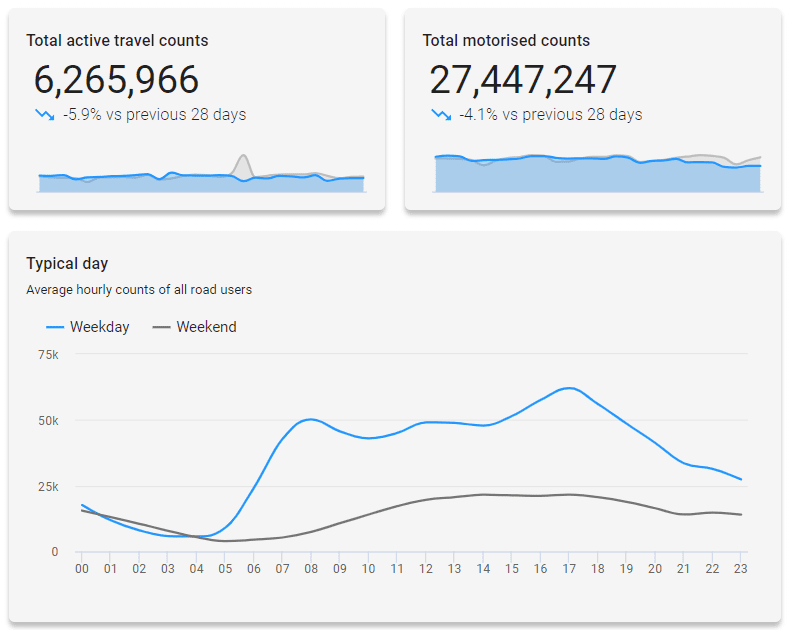
1. Classified Counts and Traffic Flow surveys
To provide authorities with a clear understanding of the volumes and types of road users passing through a particular part of the network, Classified Counts and Traffic Flow surveys are carried out.
Classified traffic volume data supports the efficient management of traffic, with insights into infrastructure usage at different times of the day and week, seasonal patterns and the impact of large scheduled events on traffic flow.
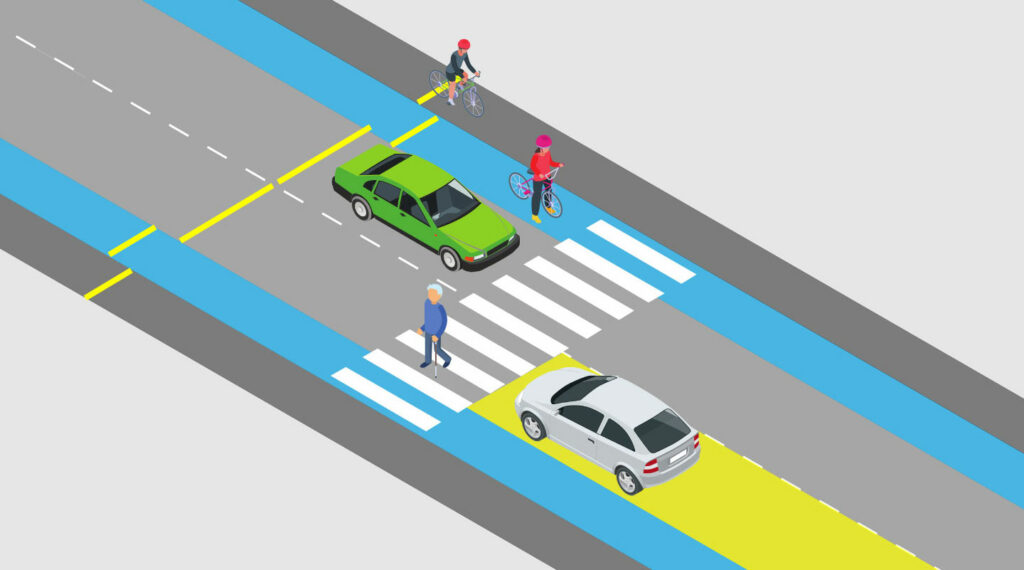
Unlike traditional traffic survey methods, Viva provides cycling, walking and e-scooter counts data. In addition to this, multiple ‘countlines’ can be positioned in the sensor’s field of view. This can be especially useful to understand the volume of cyclists using the roadway vs. bike lane vs. sidewalk.
2. Active Travel Trends, Behaviours and Modal Shift surveys
Encouraging an increase in active travel modal share is a major goal for many authorities. Data that shows cycling and walking trends and behaviours supports the planning and implementation of schemes targeted at sustainable modal shift.
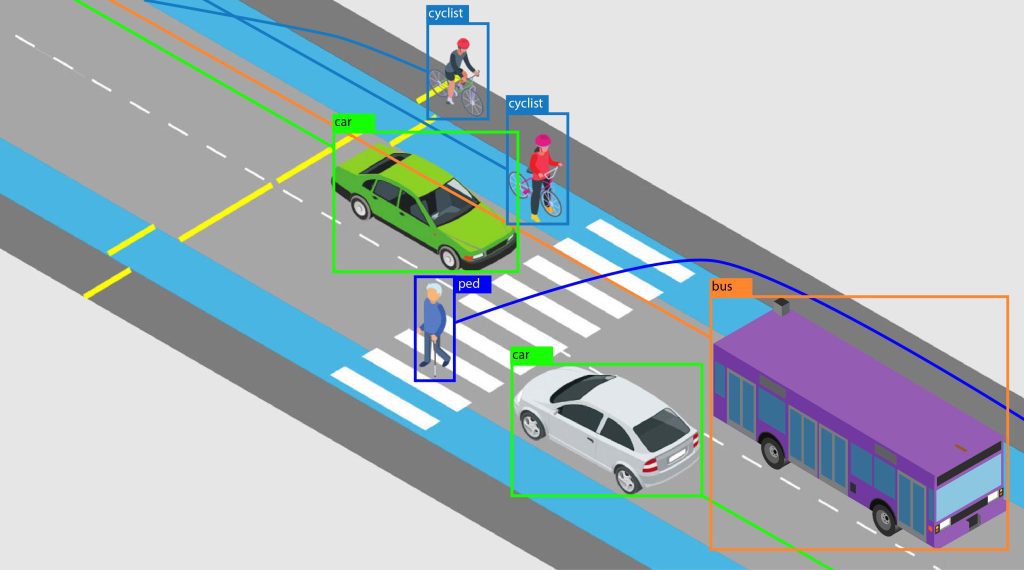
As well as count data, Viva sensors provide active travel movement data. This data is referred to as Tracks and illustrates multimodal movement in the sensor’s field of view. This is useful data for ascertaining desire lines.
Optimised for long-term data collection, Viva sensors are a cost-effective way to gather pre- and post-intervention data to understand how a scheme has performed against modal shift goals.

Learn how Westminster City Council used Tracks data in their evaluation of School Streets Trials. This involved analyzing how restricted vehicle access impacted pedestrian crossing behaviours.
3. Incident Hotspot and Near Miss Diagnostic surveys
Analyzing road safety risks and incident hotspots has traditionally relied on collision and casualty reports or anecdotal accounts of perceived safety. Based on unreliable and often incomplete data, this traditional approach limits road safety improvements to reactive interventions.
But this doesn’t have to be the case!
Viva sensors perform incident hotspot surveys that identify near miss events and diagnose their root cause*. This data supports targeted road safety improvements and can be used pre- and post-intervention to evidence results.
*How does Viva define a near miss event? Near miss events are collisions that could have happened but by chance didn’t. Viva sensors identify near miss events using advanced 3D object detection, Tracks and Speed data.
Learn more about Viva’s Near Miss feature and how it can support Active Travel and Road Safety schemes
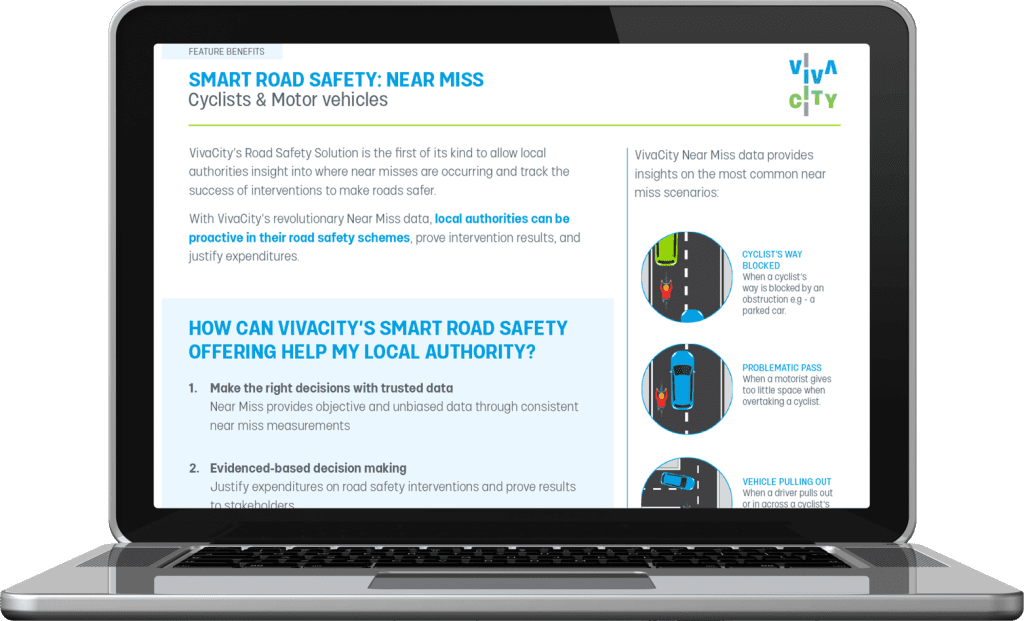
Discover how Near Miss data can support your authority achieve their Vision Zero goals and enhance your road safety initiatives:
- Identify hazards before incidents occur
- Make data-based decisions and justify expenditure
- Perform post-intervention analysis to measure results
Fill in the form to receive the Near Miss Feature Benefits Guide straight into your Inbox.
For more detailed information about Near Miss and how it supports active travel and road safety surveys, please visit our dedicated online resource below.
With Near Miss data, authorities can make investment decisions that draw on predictive data gathered in incident hotspot surveys. This approach supports strategic investment into road safety improvements at the most dangerous areas of the network, without relying on a collision or casualty to be reported.

Oxfordshire County Council are using Near Miss data to understand road safety risks for cyclists on a busy junction. This data is able to provide insights on why near miss events occur and identify trends and patterns.
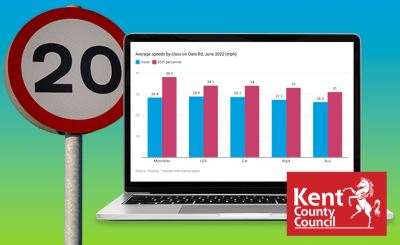
4. Speed surveys
Speed is a contributing factor to large proportion of fatal collisions on roads. Traffic speed survey data enables councils to identify speed trends at key locations. This data can guide traffic calming measures that will keep road users safe. This data can also indicate aherence to speed limits.
Viva sensors provide two types of speed data for a range of transportation modes:
- Countline Speed: Speed distributions for different classes of road users. This data is displayed in ‘speed buckets’. You can set the speed range of each bucket.
- Zonal Speed: Accurate average speed data for different classes or road users. This makes it possible to compare the speed of different transportation modes.
Optimised for long-term monitoring, the Viva speed survey solution is ideal for comparing speed trends across days of the week, months and years.
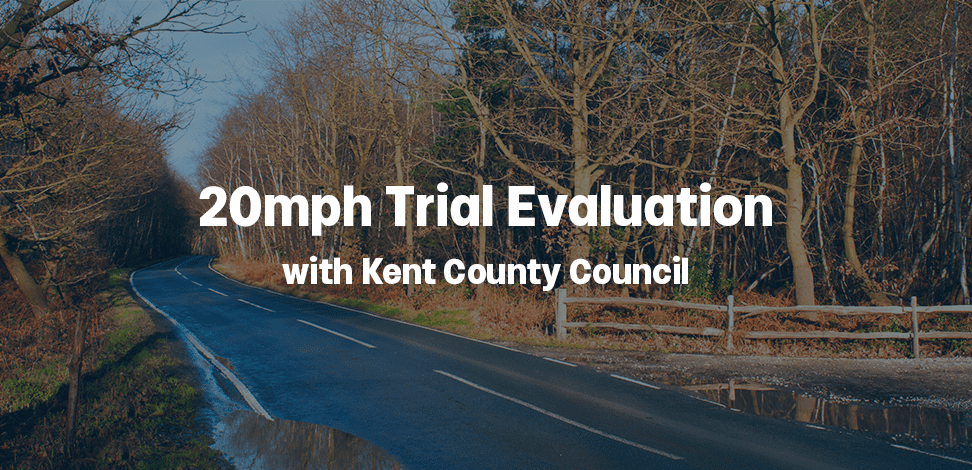
Kent County Council used Viva speed data to monitor the impact of 20mph trials at a range of sites in Tonbridge and Faversham, including rural roads and roads near schools. This data has been used to inform the introduction of permanent speed limits.
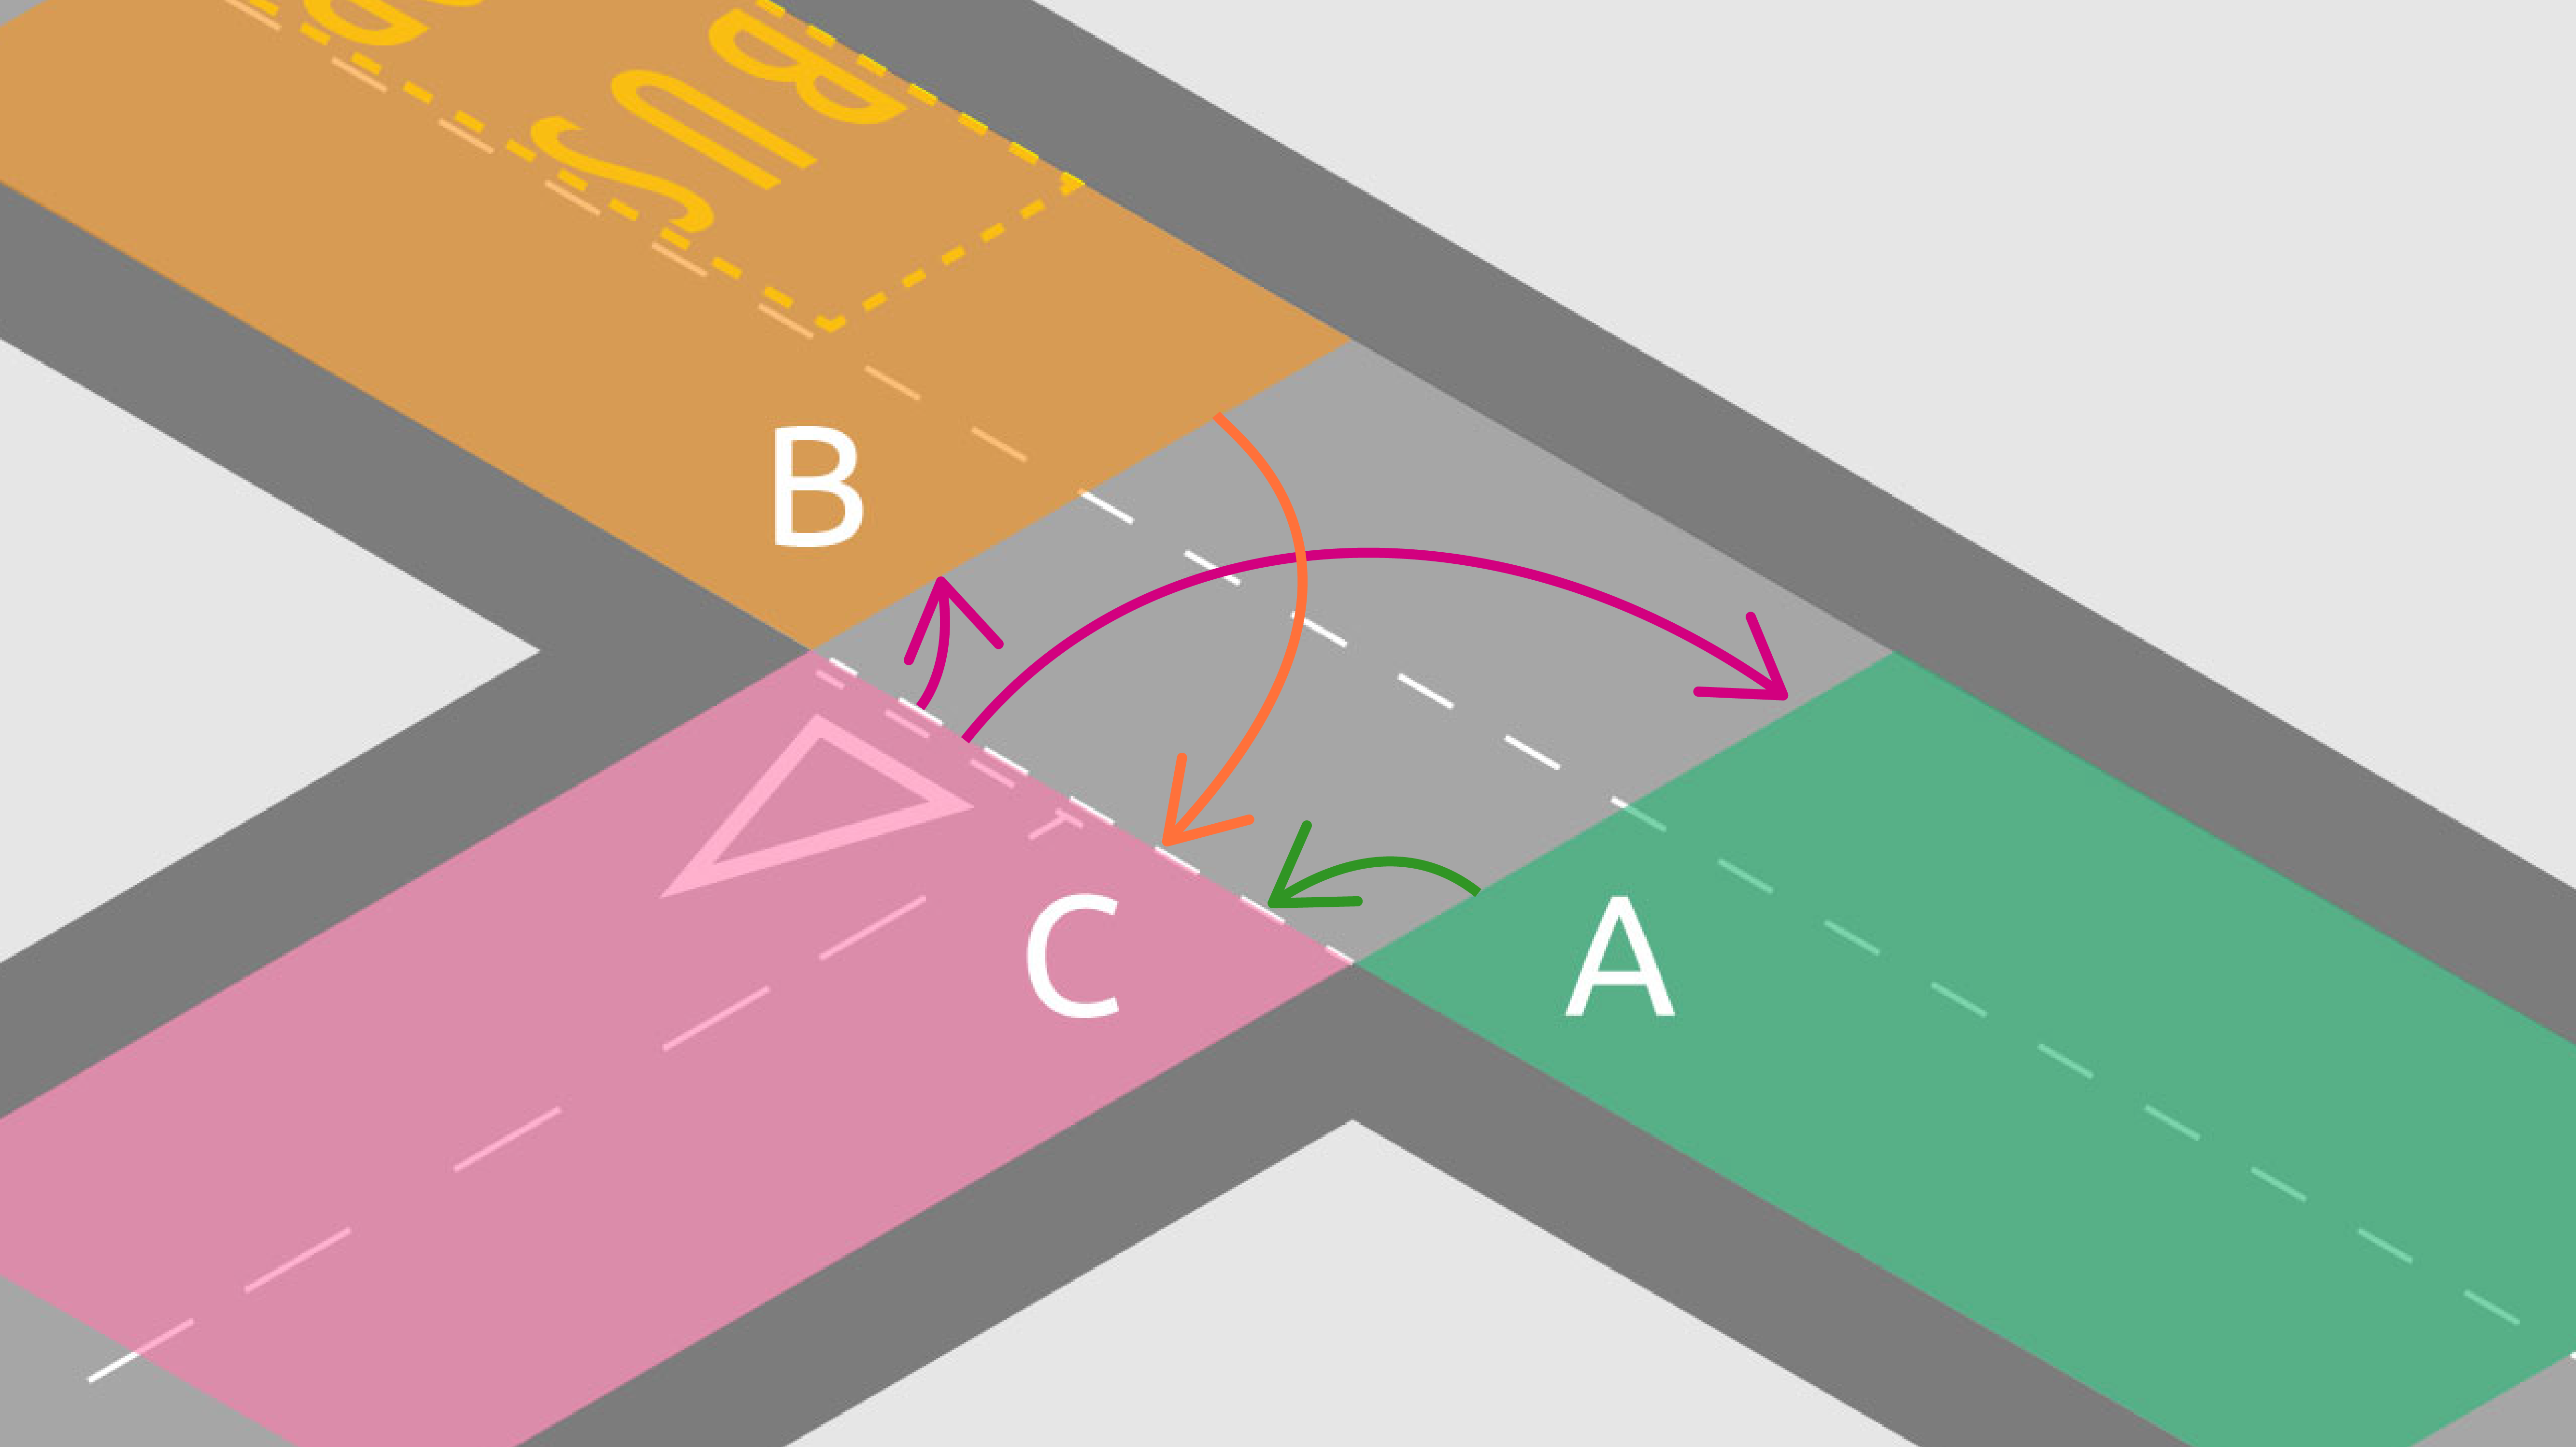
5. Turning Movement Count surveys (TMC)
Supporting the understanding of how junctions are used, Turning Movement Count surveys can also highlight dangerous movements, for example turning movements into a road that is No Entry.
Viva sensors perform Turning Movement Count surveys by using origin and destination zones and Tracks data, based on the movement of interest. As with other surveys, Turning Movement Count data is is available for a range of transportation modes, including cyclists, pedestrians, e-scooter, and a range of motorized vehicles.
Like our content? Sign up to our newsletter and receive the latest updates in your inbox.
Sign-Up