
Almost a third of all trips to school in the UK are made by walking. For Walk to School Week 2022, we look at the scale of walking to school, some of the barriers and how our traffic sensors have helped a local council to evaluate the impact of implementing two School Streets.
Walk to School Week 2022 #PowerUp campaign
Walk to School week is an annual celebration of the walk to school. Organised by Living Streets, this year’s Walk to School week (16 – 20 May) features the #PowerUp challenge. It aims to encourage students to take healthier journeys to school through video game-inspired design. It focuses on how a modal shift to walking to school will make the roads surrounding schools safer, greener places and improve students’ health, sense of independence and awareness of the local community.
Walking to school is more prominent than walking for any other purpose
Statistics published by the DfT show that on average 32% of all trips made in 2021 were on foot. When comparing travel modes by purpose, data shows that travel to school has the largest proportion (43%) of walking as a main mode of transport. However, motorised transport is still more common (47% of trips to school), highlighting the importance of campaigns like Walk to School Week.
Taking a holistic approach to School Streets as part of the Walk to School movement
Research has shown that parents’ perception of road safety is a significant barrier to walking to school. Reducing the volume of vehicular traffic via School Streets schemes is a popular way for local authorities to improve road safety around schools, but for a maximum impact, a holistic approach is key.
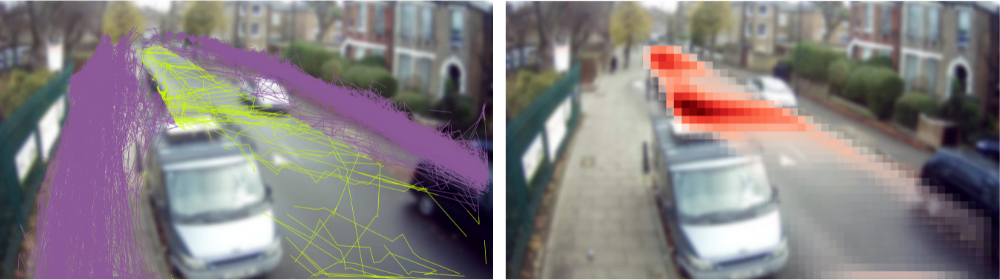
AI-powered computer vision monitoring can accurately classify and count cars, cyclists and pedestrians. These datasets are extremely powerful when combined with parent and pupil surveys for evaluating modal shift in response to School Streets schemes. Data on speed, pedestrian paths and near miss events can provide further insights into the impact of School Streets.
Importantly, this technology has been optimized for long-term monitoring use. Habits are not created or changed overnight - they take time to develop. Sharing the results of interventions with the community is the most powerful way to communicate road safety around schools and encourage parents and children to Walk to School.
Analysing School Street impact using the Healthy Streets framework
A recent analysis by the University of Westminster explored the impact of School Streets Interventions in the context of broader public health using the Healthy Streets Framework.
The framework represents a human-centred, holistic approach to transport planning and urban design, considering both the physical characteristics of the street and how the street makes its users feel. It also advocates active transportation.
The report examined two School Streets schemes implemented in Hackney, London at Fairholt Road and Rendlesham Road using Viva sensor data:
“Working through this rich dataset of traffic and active transportation movement at two schools has shown the impact that temporary restrictions can have on changing how people use their streets. These findings will hopefully be useful for practitioners seeking to understand what effects School Streets might have on the environments that children travel through as they arrive at school.
These findings also show how helpful continuous monitoring can be in assessing the impacts of temporary closures, not just when they're in place, but also over the course of days, weeks and months".
Asa Thomas, PhD Researcher at the Active Travel Academy
Below we present four key findings from the analysis. You can access the full report here.
1. There is a decrease in motorised traffic beyond restricted hours
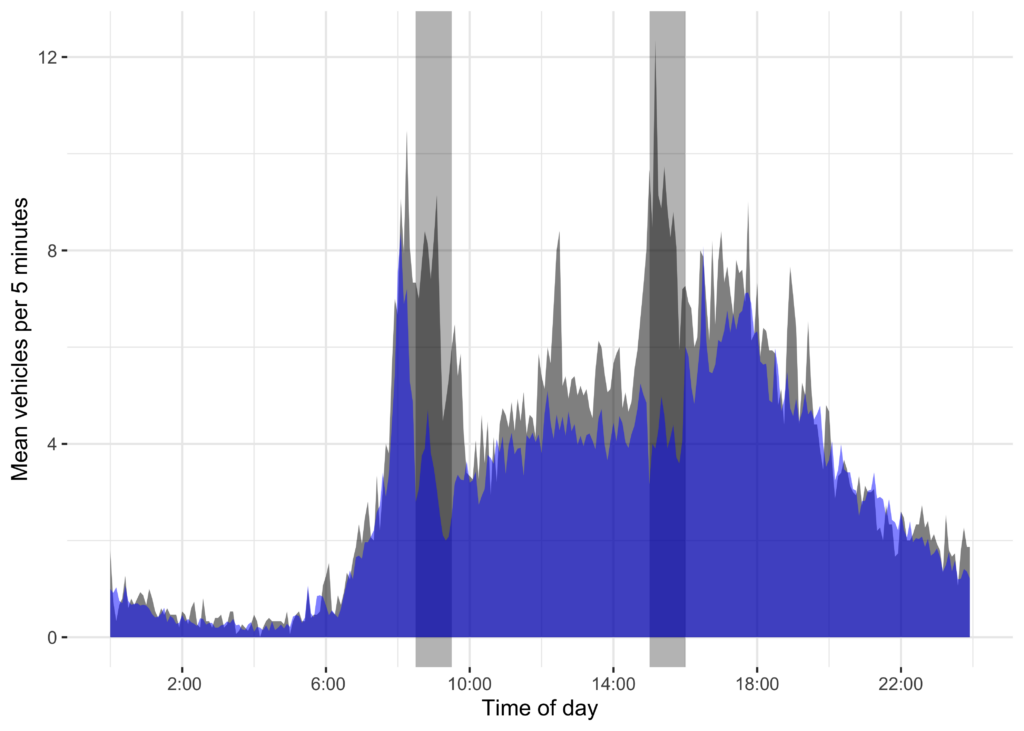
As intended, the School Streets bring about a notable decrease in motorised traffic at school pick up and drop off times during operation. However, the data also shows a general decrease in motorised traffic along the School Street which persists throughout the day, outside of closure times.
This ‘afterglow’ effect suggests that temporary closures could lead to drivers avoiding School Streets altogether. Long-term monitoring will establish whether the diverted routes will endure as the new normal for drivers.
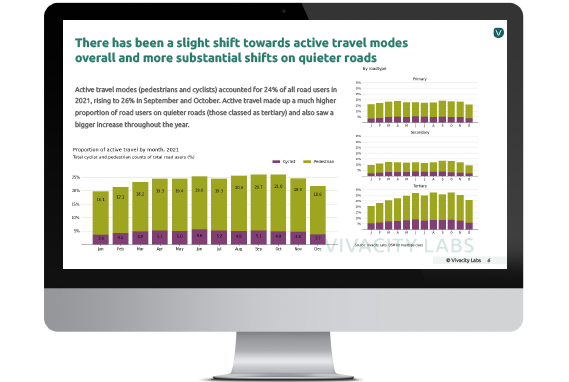
While the data does not show a notable change in pedestrian counts during closure times, there is evidence of more cyclists on the School Streets at one of the monitored sites.
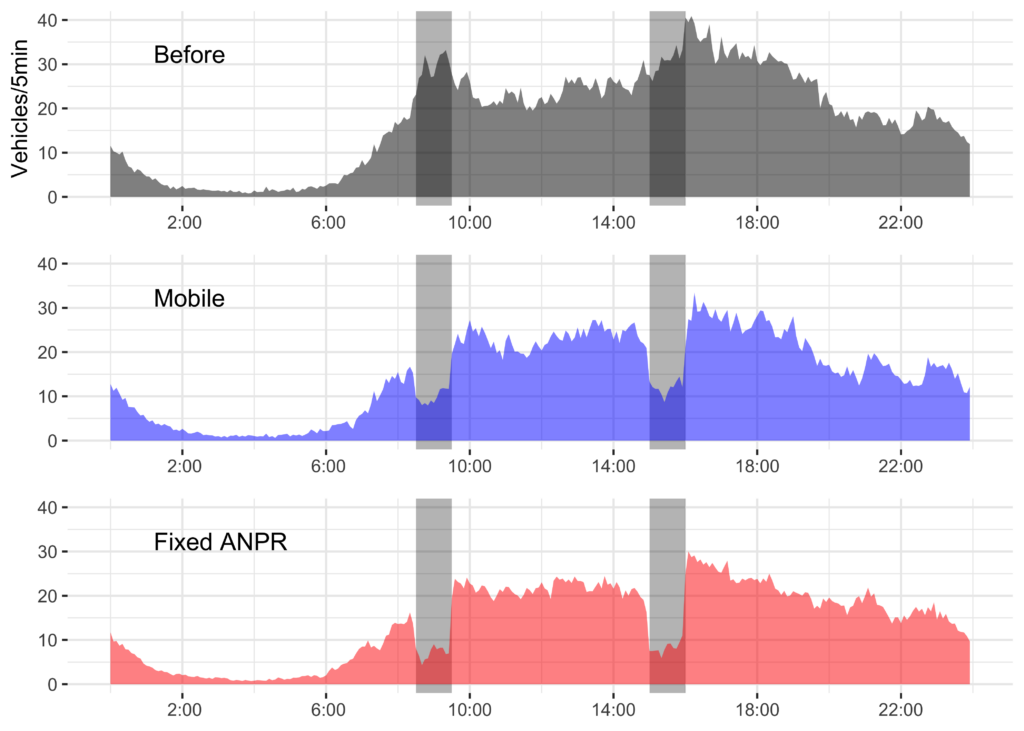
2. ANPR enforcement improves the effectiveness of School Streets
Mobile ANPR decreased traffic during closure times at both sites. However, fixed ANPR proved even more effective for Fairholt Road, recording a 63% decrease in traffic with mobile ANPR and 75% decline with fixed ANPR provisions. This suggests that continuous enforcement methods should be considered when implementing School Streets on busier roads.
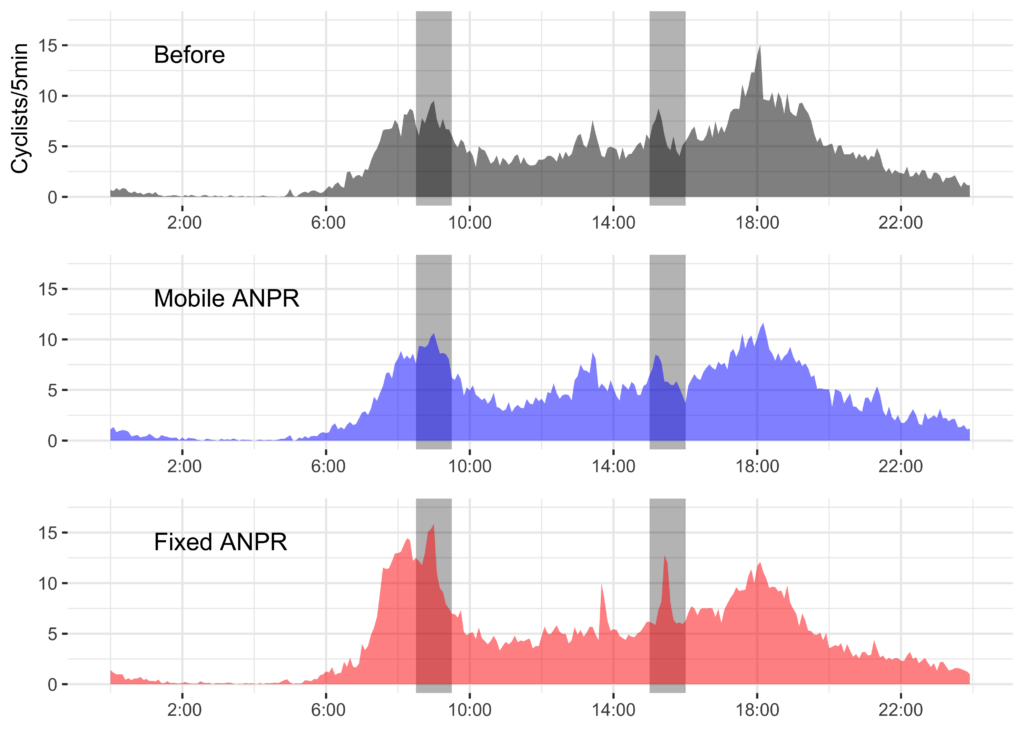
The decrease in motorised traffic coincides with an increase in the number of cyclists. Fairholt Road saw a gradual increase in cyclists with mobile ANPR (14%) and a further increase with fixed ANPR (40%) during closure times. There was also a general increase in cyclists throughout the day (16%) on Fairholt Road. These figures could indicate a rise in cycling to school but might also be influenced by other factors such as weather conditions.
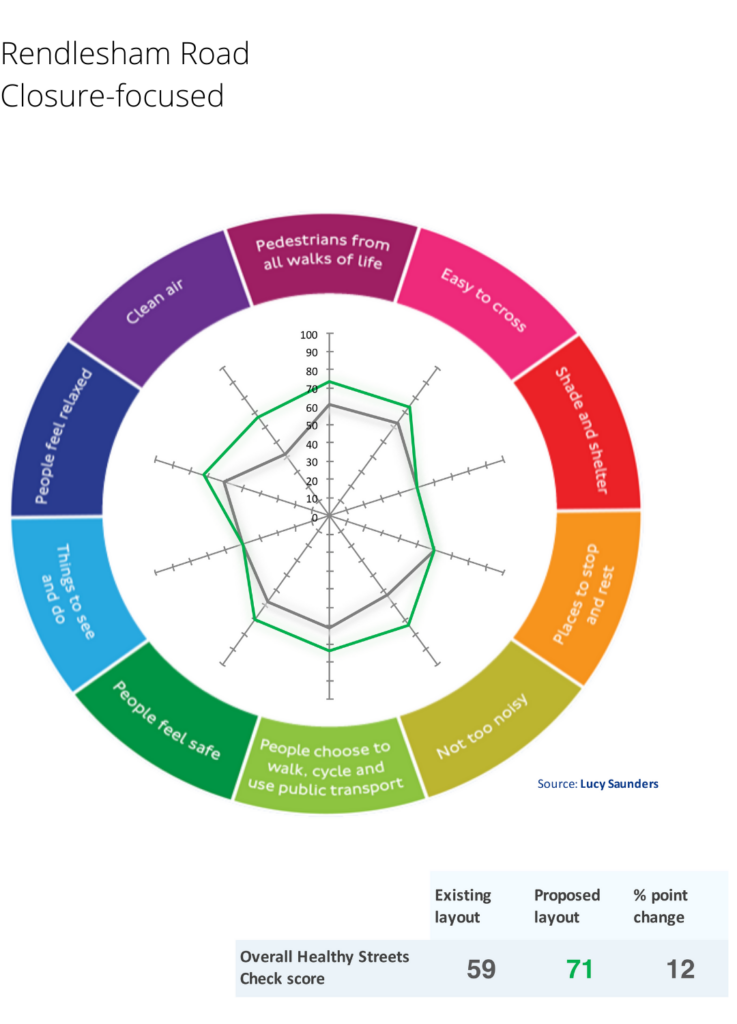
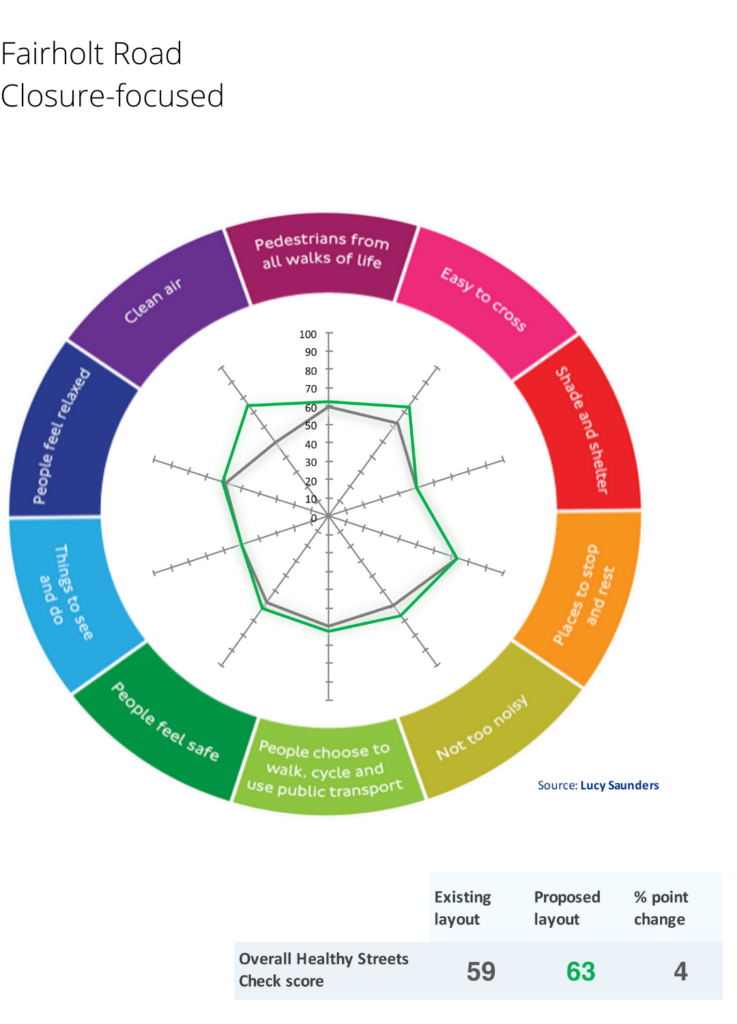
3. School Streets can improve Healthy Streets scores
Comparing Healthy Streets scores before and after the School Streets implementation, shows an improvement in Healthy Street scores, primarily driven by the decrease in traffic. Notable improvements are in the indicators ‘clear air’ and ‘not too noisy’, while ‘easy to cross’ and ‘people choose to walk and cycle’ are increased but to a lesser extent. Find out more about the framework and scoring system here.
This suggests the need for further changes to the built environment to facilitate pedestrian movement.


4. Designing streets that encourage parents and children to Walk to School
Sensor data also gives insight into where people walk - on the carriageway or the pavement. For Fairholt Road there was a slight increase in pedestrians using the carriageway from 3.8% before implementation of the School Street to 4.2% when the full ANPR was installed. On Rendlesham Road, 16% of pedestrians used the carriageway after the School Street was introduced.
Overall, there has not been a significant difference in pavement and carriageway use before and after School Streets introduction. On-going analysis of path data will allow local authorities and policymakers to understand how pedestrians use the street space and how School Streets are impacting movement. This can inform the design of street crossings and help identify problematic sections where further interventions might be needed.
The Impact of the Pandemic on Active Transportation in 2021
Learn about the pandemic’s impact on modal shift in our recent report
Like our content? Sign up to our newsletter and receive the latest updates in your inbox.
Sign-Up