 Examining the impact of Covid-19 on traffic flow in Cambridge.
Throughout the pandemic Viva have been supporting clients and partners to improve understanding about the impact on transport modes usage and and traffic movement in towns and cities.
Cambridge County Council has multiple Viva sensors installed across the city to monitor traffic flows. Michael Stevens, Enabling Digital Delivery Project Manager at Cambridgeshire County Council, has been using sensor data to look at the the impact of Covid-19 and government guidance on transport types and traffic in the Cambridge region.
“The data collected from Viva sensors gives us a better understanding of how people move around Cambridge and the impact of planned and unplanned events. By understanding the impact that Covid-19 has had on movement during the current lockdown, as measures are extended, changed or relaxed and likely future trends as things return to normal we will be able to adapt our transport planning and policies to respond to new behaviors.” Michael Stevens, Enabling Digital Delivery Project Manager, Cambridgeshire County Council
The results showed a 50% drop in traffic movement at each location compared to the usual flow over the five weeks from March 16 2020 (first UK lockdown began on 23 March 2020). Car traffic flow decreased by 72% and bus traffic by almost 50%.
Cambridgeshire County Council has been sharing this data with their Highways team, and in particular the Street Works team so they can make more informed decisions during this time on the implementation of guidelines and the effectiveness of any interventions.
“Since the Covid-19 lockdown started, we have been working closely with all of our clients to help analyse the data we are providing them. This data source has formed a critical part in understanding the effectiveness of various lockdown measures as they have been brought in, but will be even more critical in providing quick feedback when the lockdown begins to be relaxed to ensure that the reduction in Social Distancing does not happen too quickly. This is a new use case for our data, but it really goes to show the power of having reliable, quality multi-modal data at your fingertips.” Peter Mildon, COO, Viva
More detailed anaylsis of this project can be found below.
Please contact us to discuss your transport data requirements.
Vehicular flows in Cambridge
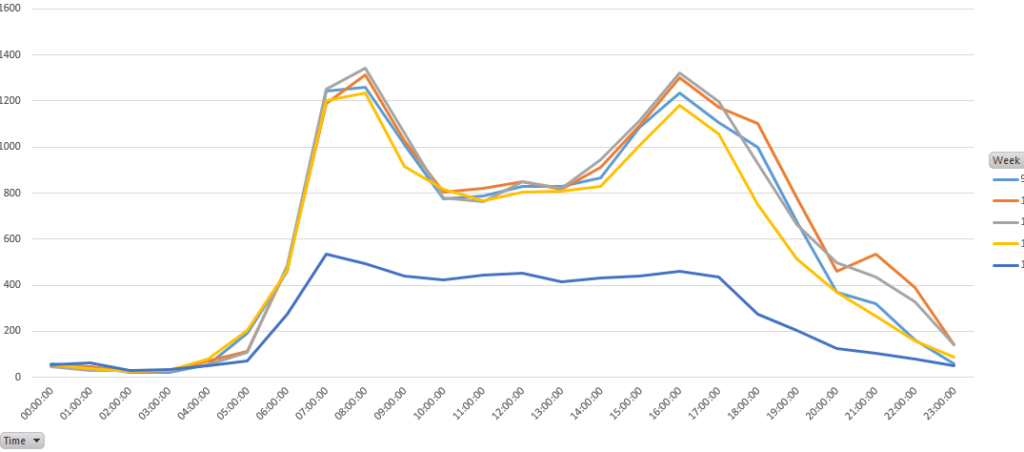
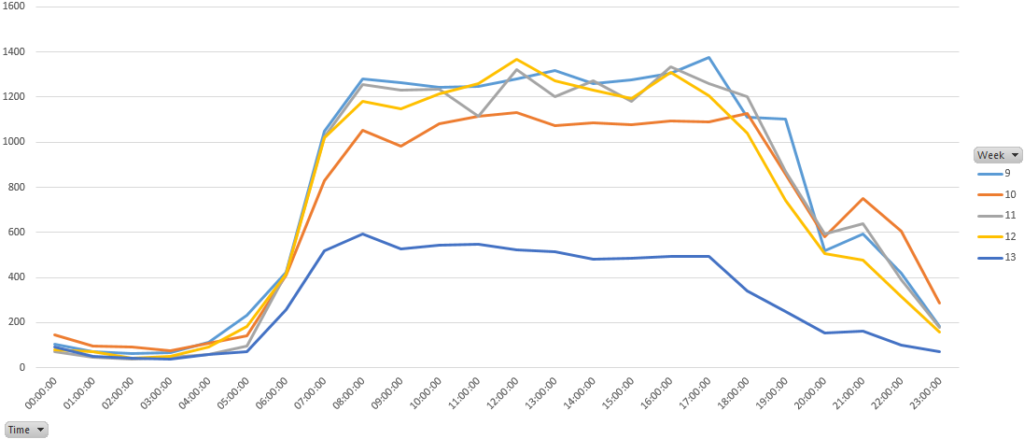
The below example graphs show the 2-way traffic flow at each sensor location for the last 5 Tuesdays.
Results speak for themselves – there has been over a 50% drop in traffic movement at each location when compared to their usual flow.
Cambridge Road – Data of every Tuesday from the 25/02/2020 to the 25/03/2020 – sum of total vehicles by time of day.
Newmarket Road – Data of every Tuesday from the 25/02/2020 to the 25/03/2020 – sum of total vehicles by time of day.
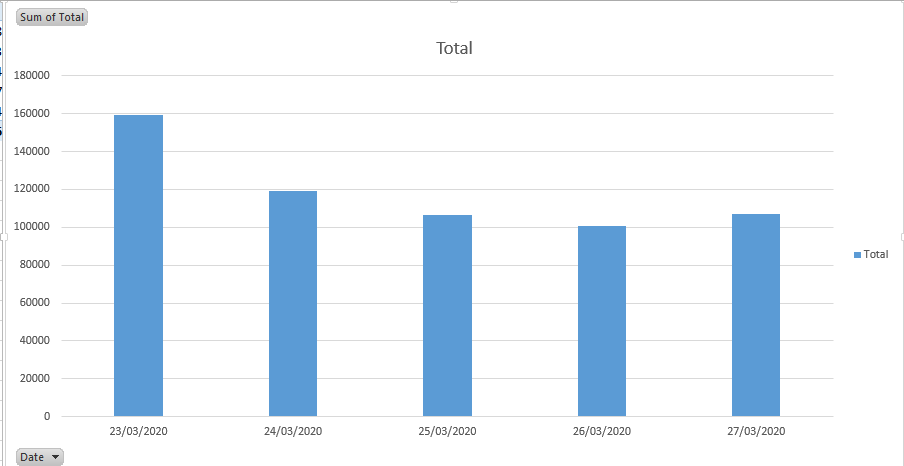
The graph below shows the comparison for the total traffic flow count across all sensors for every weekday last week, clearly demonstrating that flow began to reduce and then tail off as of Wednesday 25th March.
Traffic Flow counts across 9 sensors on key routes in Cambridge from 09/03/2020 to the 01/04/2020.
Traffic flow started to decrease from the 16/03/2020 with another drop when the UK was put in lockdown on the 23/03/2020.
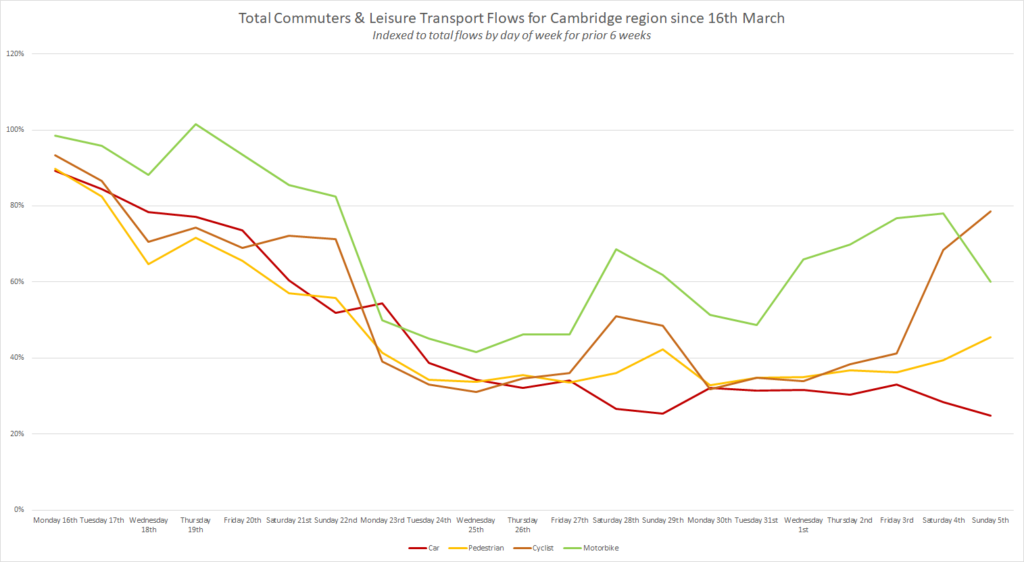
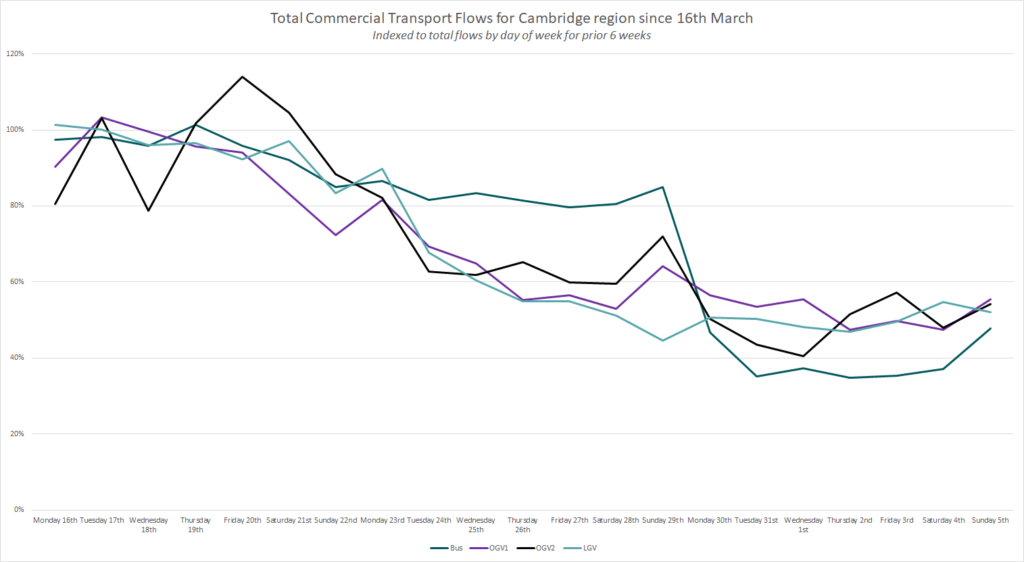
Total Transport Flows (sum of vehicles) for Cambridge from the 16/03/2020 to the 05/04/2020
General trend is a massive decrease of the traffic flow
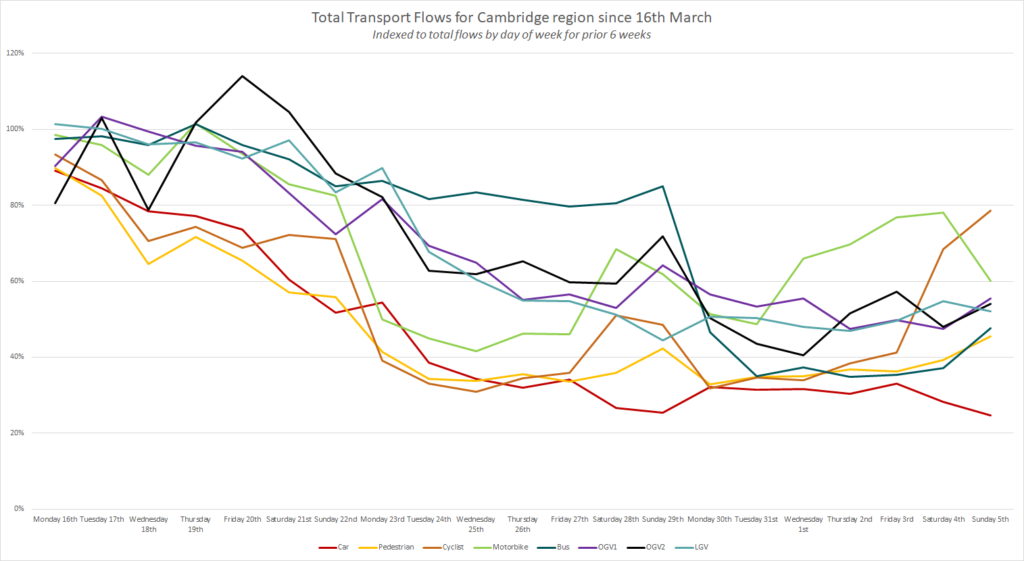
Car traffic flow decreased from 72%.
Cyclists decreased by 55% before Friday 3-04-20 before increasing again by 50% on the weekend
Bus traffic decrease of almost 50%.
At Viva, privacy is at the heart of everything we do. Our sensors do not collect personal data, and none of our clients can use our technologies to gather any kind of personal data, ever. Read more detail on our robust data privacy policy here.
If you would like to discuss a COVID-19 data project in your town or city, please contact us.